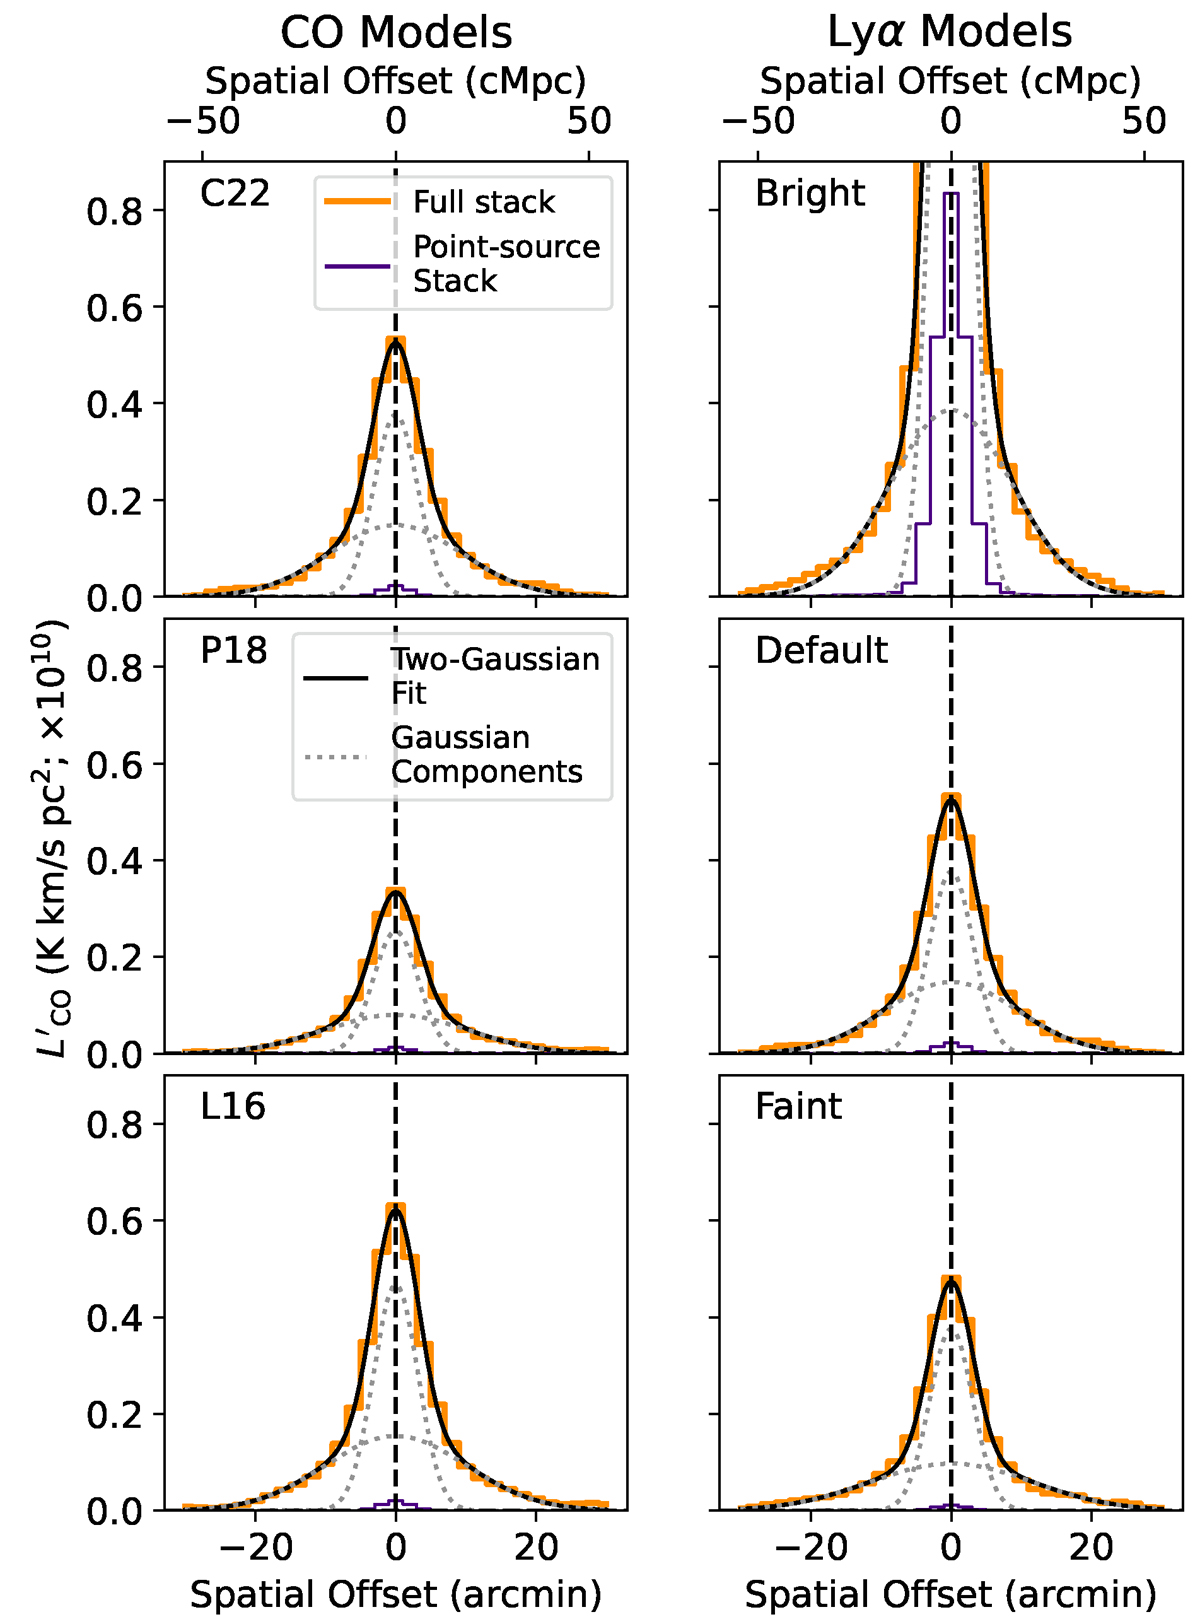
Fig. B.1.
Download original image
One-dimensional spatial profiles of stacks performed on simulations generated using various CO (left) and Lyα (right) models. For each profile, we plot the stack on the full simulated map (the orange lines) as well as a stack performed on a simulated map that contains only the DM halos included in the galaxy catalogue being stacked on (so there is no contribution at all from neighbouring halos; the indigo lines). We also plot a two-Gaussian fit (black lines) as well as the two Gaussian components individually (grey dotted lines).
Current usage metrics show cumulative count of Article Views (full-text article views including HTML views, PDF and ePub downloads, according to the available data) and Abstracts Views on Vision4Press platform.
Data correspond to usage on the plateform after 2015. The current usage metrics is available 48-96 hours after online publication and is updated daily on week days.
Initial download of the metrics may take a while.