Fig. 5.
Download original image
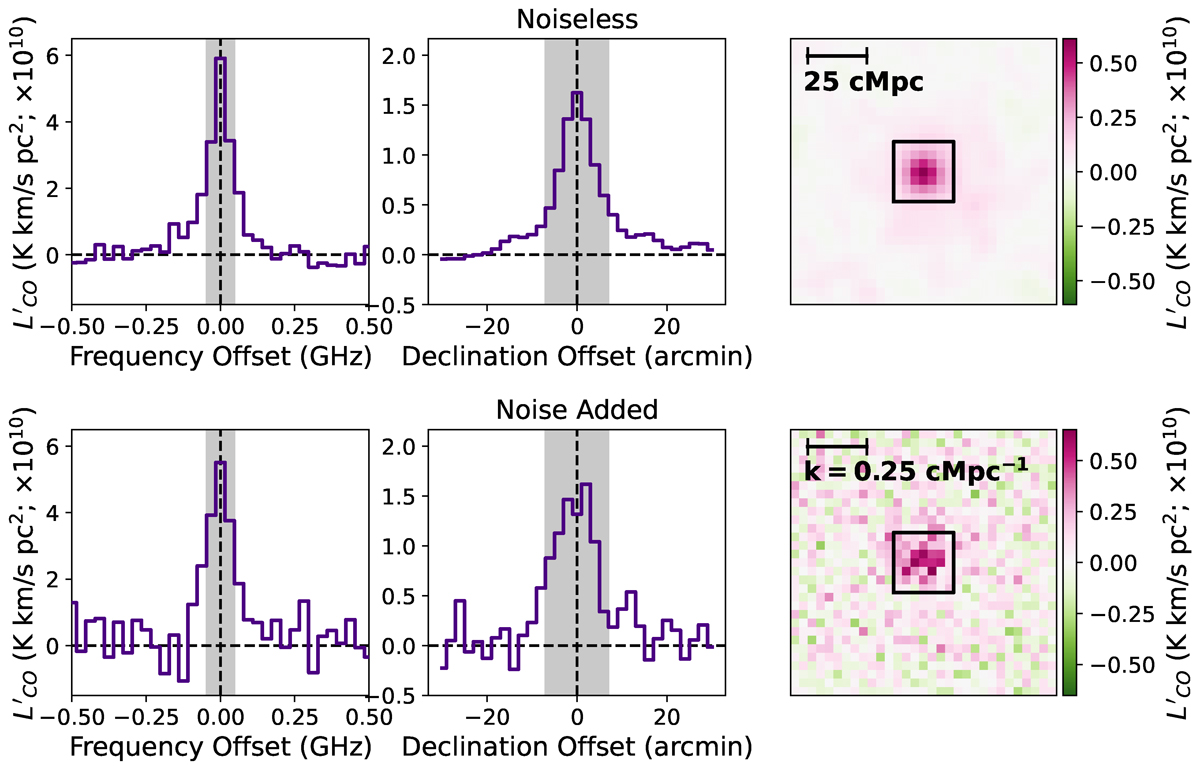
One- and two-dimensional projections of a simulated stack cubelet generated using the default simulation parameters. The top row shows a simulation realisation with no added noise (variations are due to individual simulated halos), and the bottom row shows the same simulation realisation with added radiometer noise (following Section 2.5). Left: frequency spectrum of the central stack aperture. The Nchan frequency channels that are integrated over to generate the final stack luminosity are highlighted in grey. Center: spatial profile of the stack determined by summing over the three central frequency channels (those highlighted in the spectrum) into an image (shown in the right panel) and then collapsing the RA axis by summing over the three central spaxels. The spatial profile plots this quantity as a function of the angular offset in the declination direction from the stack centre. As in the spectrum, the width of the spatial aperture over which the emission is integrated to generate the final stack luminosity is highlighted in grey. Right: two-dimensional image with the Nspax × Nspax spatial aperture boxed in black.
Current usage metrics show cumulative count of Article Views (full-text article views including HTML views, PDF and ePub downloads, according to the available data) and Abstracts Views on Vision4Press platform.
Data correspond to usage on the plateform after 2015. The current usage metrics is available 48-96 hours after online publication and is updated daily on week days.
Initial download of the metrics may take a while.