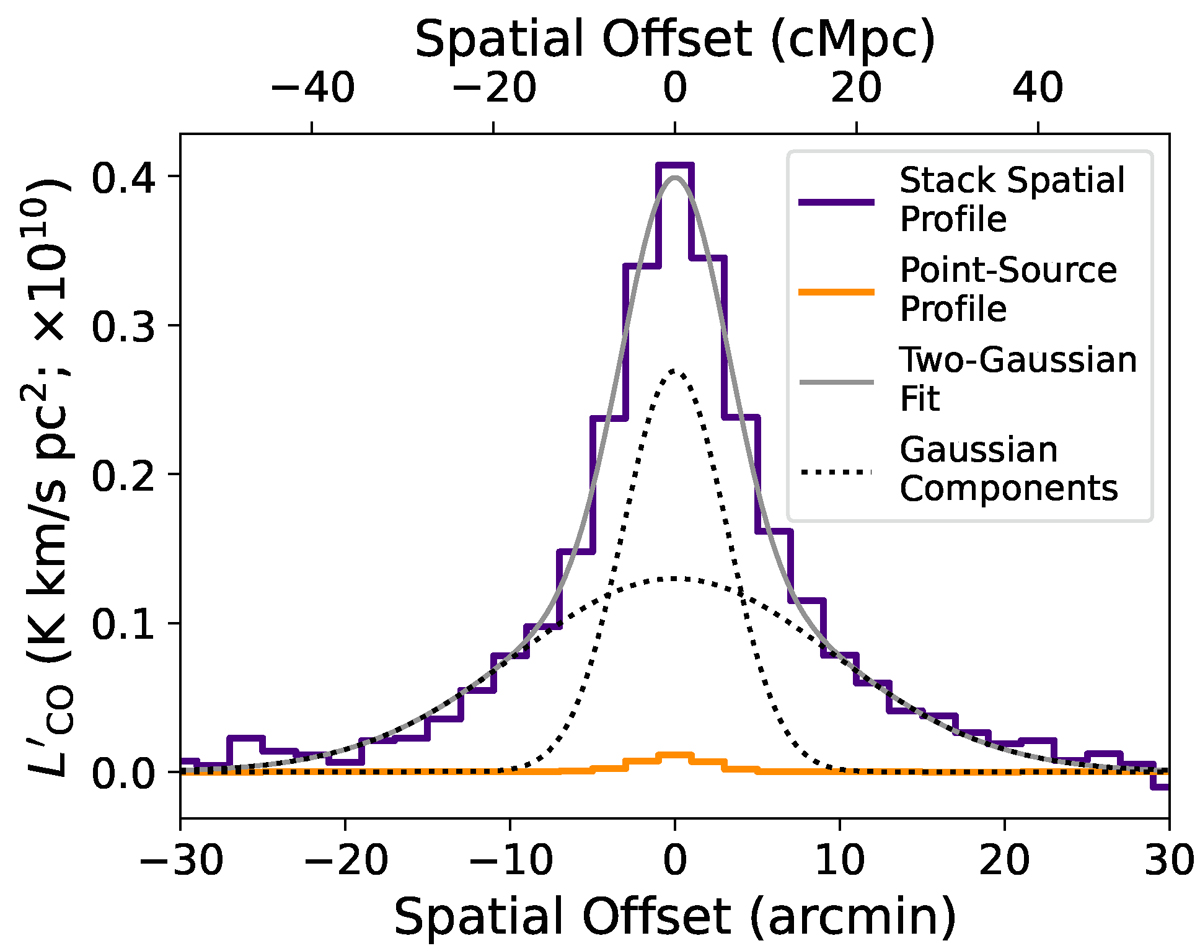
Fig. 7.
Download original image
Average one-dimensional spatial profile of 99 noiseless simulated stack realisations. A double-Gaussian fit to the profile is shown in grey, with each of the Gaussian components shown as black dotted lines. The orange profile is a stack performed on simulations that have CO luminosity painted only onto the halos actually included in the mock galaxy catalogue, to demonstrate the extent to which the stacked signal is the result of halo clustering.
Current usage metrics show cumulative count of Article Views (full-text article views including HTML views, PDF and ePub downloads, according to the available data) and Abstracts Views on Vision4Press platform.
Data correspond to usage on the plateform after 2015. The current usage metrics is available 48-96 hours after online publication and is updated daily on week days.
Initial download of the metrics may take a while.