Fig. 9.
Download original image
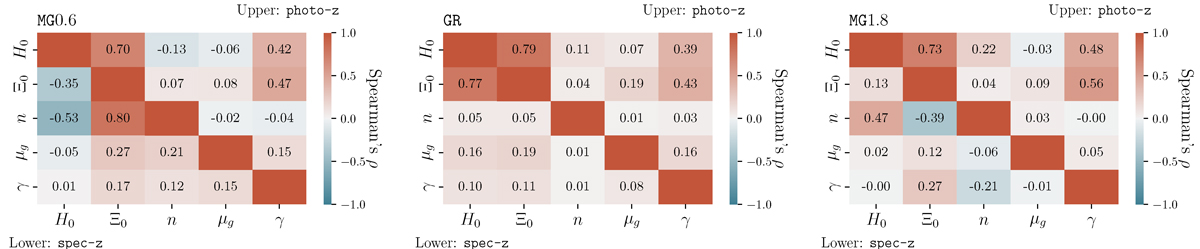
Correlation among selected hyperparameters in first MCMC configuration. The strength and direction of the correlation were quantified with a Spearman coefficient. In each panel, the upper corner plot shows the results in the photo-z case, while the lower triangle shows the results in the spec-z case. The left panel shows results from the MG0.6 GW catalog, the center panel from the GR catalog, and the right panel from the MG1.8 GW catalog.
Current usage metrics show cumulative count of Article Views (full-text article views including HTML views, PDF and ePub downloads, according to the available data) and Abstracts Views on Vision4Press platform.
Data correspond to usage on the plateform after 2015. The current usage metrics is available 48-96 hours after online publication and is updated daily on week days.
Initial download of the metrics may take a while.