Fig. 1
Download original image
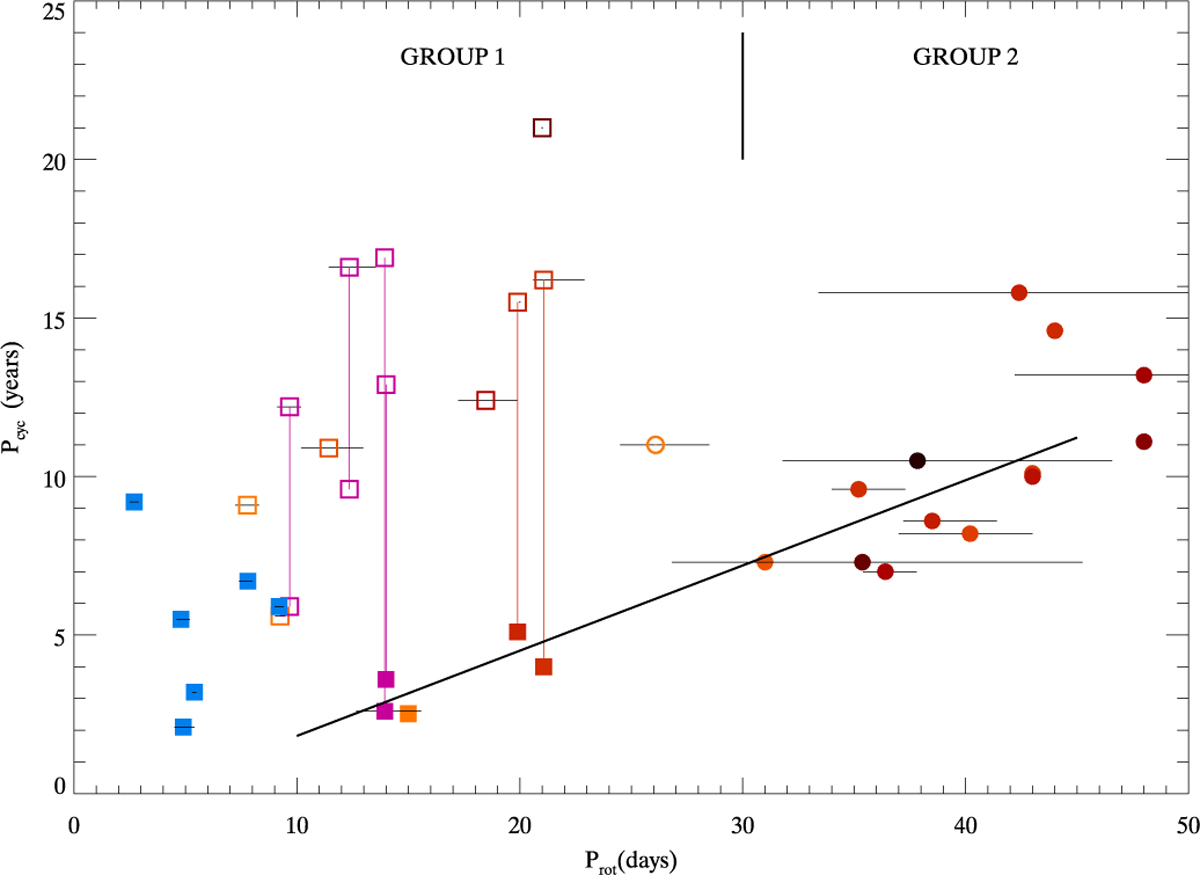
Relationship between Pcyc and Prot for the stars in the original sample selected in Paper I and the young solar analogues from Messina & Guinan (2003) (blue squares), together with the fit to the original sample, log Pcyc(obs) = −0.95(±0.16) + 1.21(±0.11) log Prot, which includes group 2 (except the Sun) and the shorter periods of the stars in group 1. The horizontal error bars cover the range [Prot(max)–Prot(min)] derived in Donahue et al. (1996).
Current usage metrics show cumulative count of Article Views (full-text article views including HTML views, PDF and ePub downloads, according to the available data) and Abstracts Views on Vision4Press platform.
Data correspond to usage on the plateform after 2015. The current usage metrics is available 48-96 hours after online publication and is updated daily on week days.
Initial download of the metrics may take a while.