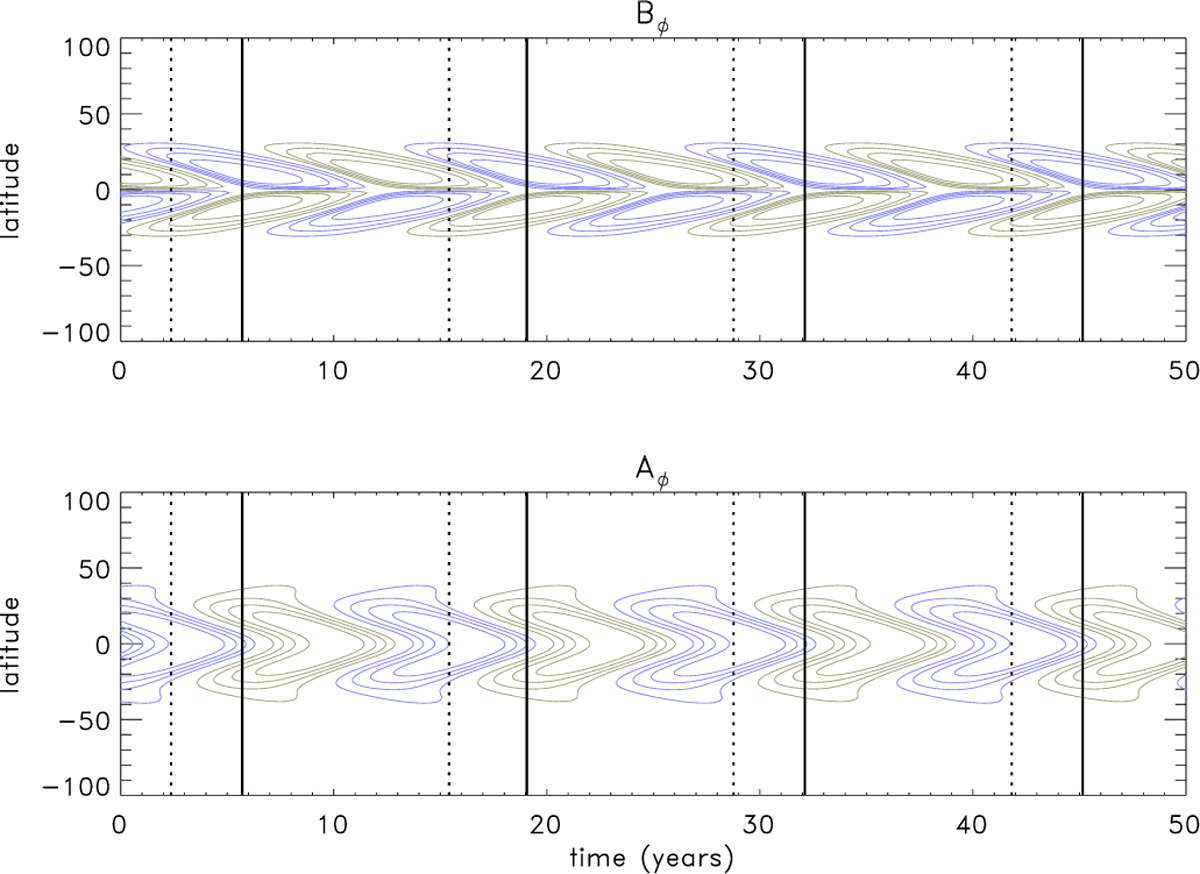
Fig. 14
Download original image
Latitudinal contours of the toroidal magnetic field obtained with a forked dynamo including α quenching. Top panel: toroidal field in the overshoot layer. Bottom panel: Azimuthal potential vector at the base of the convection zone. Solid lines represent the times when the positive toroidal field reaches its maximum and dashed lines show where the negative poloidal field is maximum. Contours correspond to the same values of Β as in Fig. 3.
Current usage metrics show cumulative count of Article Views (full-text article views including HTML views, PDF and ePub downloads, according to the available data) and Abstracts Views on Vision4Press platform.
Data correspond to usage on the plateform after 2015. The current usage metrics is available 48-96 hours after online publication and is updated daily on week days.
Initial download of the metrics may take a while.