Fig. 2
Download original image
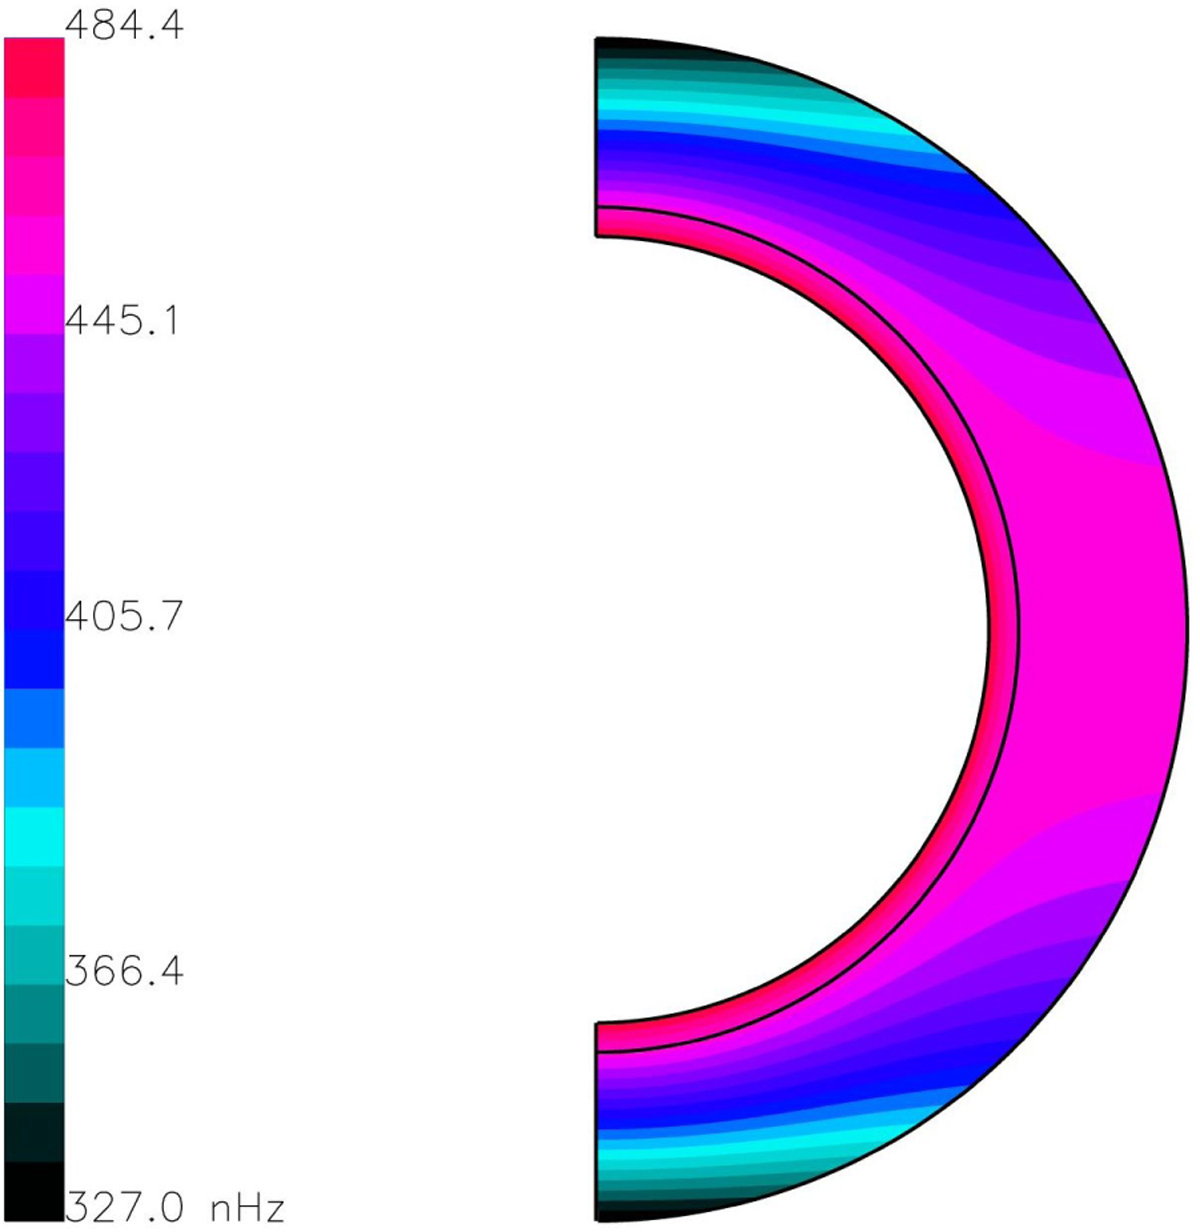
Rotation profiles with constant radial gradient in the overshoot region, taken for similarity with the local model developed in Paper I. The plotted region covers from the solar surface down to the bottom of the tachocline. The black contour indicates the bottom of the convection zone. Whereas the tachocline presents a purely radial gradient where the rotation varies from its equatorial value at the surface down to its constant value in the radiative interior, in the convection zone the rotation increases constantly from the poles to the equator and increases (decreases) from the surface towards the interior at high (low) latitudes. The figure represents the solar case, with Ω = 327.0 nHz at the poles, Ω = 457.7 nHz at the equator and Ω = 430.8 nHz in the interior, following the values of Markiel & Thomas (1999).
Current usage metrics show cumulative count of Article Views (full-text article views including HTML views, PDF and ePub downloads, according to the available data) and Abstracts Views on Vision4Press platform.
Data correspond to usage on the plateform after 2015. The current usage metrics is available 48-96 hours after online publication and is updated daily on week days.
Initial download of the metrics may take a while.