Fig. 5
Download original image
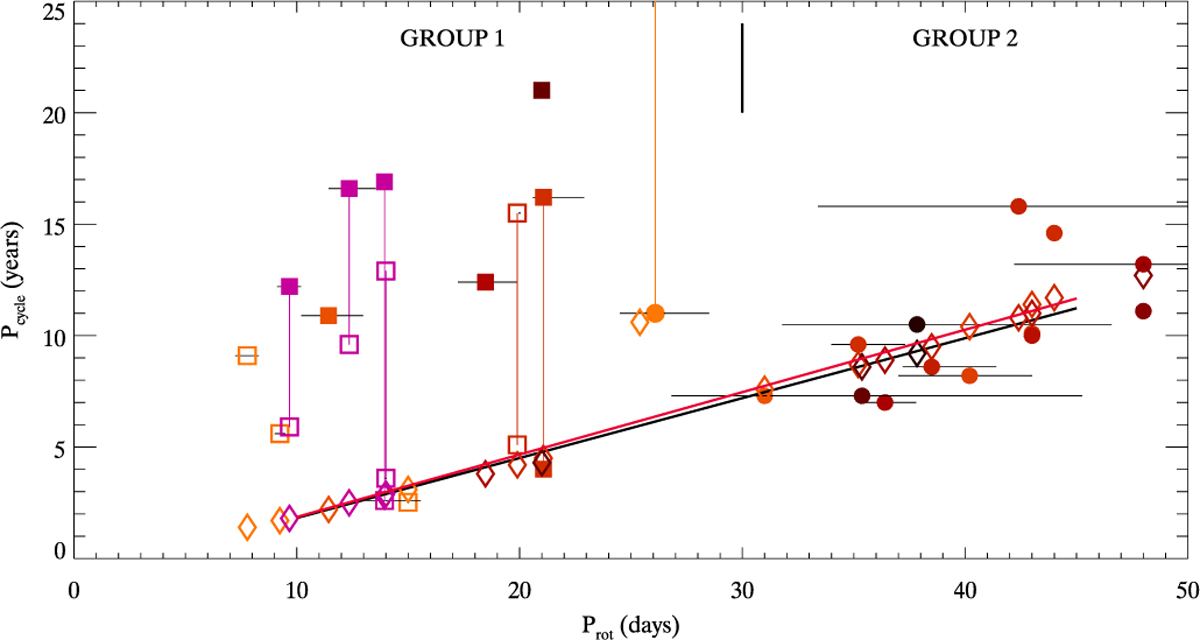
Relationship between Pcyc, both observed (see Fig. 1) and computed (diamonds), and Prot for the stars of our sample. Pcyc has been computed with the one-dimensional dynamo model with a constant radial rotation profile and a assuming that the width of the tachocline varies with the rotation as explained in the text. Colours and symbols are as in Fig. 1. The fit plotted in black corresponds to the observed relationship presented in Fig. 1 and the fit in red to the one obtained with the computed cycles (the Sun excluded) with ![]() .
.
Current usage metrics show cumulative count of Article Views (full-text article views including HTML views, PDF and ePub downloads, according to the available data) and Abstracts Views on Vision4Press platform.
Data correspond to usage on the plateform after 2015. The current usage metrics is available 48-96 hours after online publication and is updated daily on week days.
Initial download of the metrics may take a while.