Open Access
Fig. B.1
Download original image
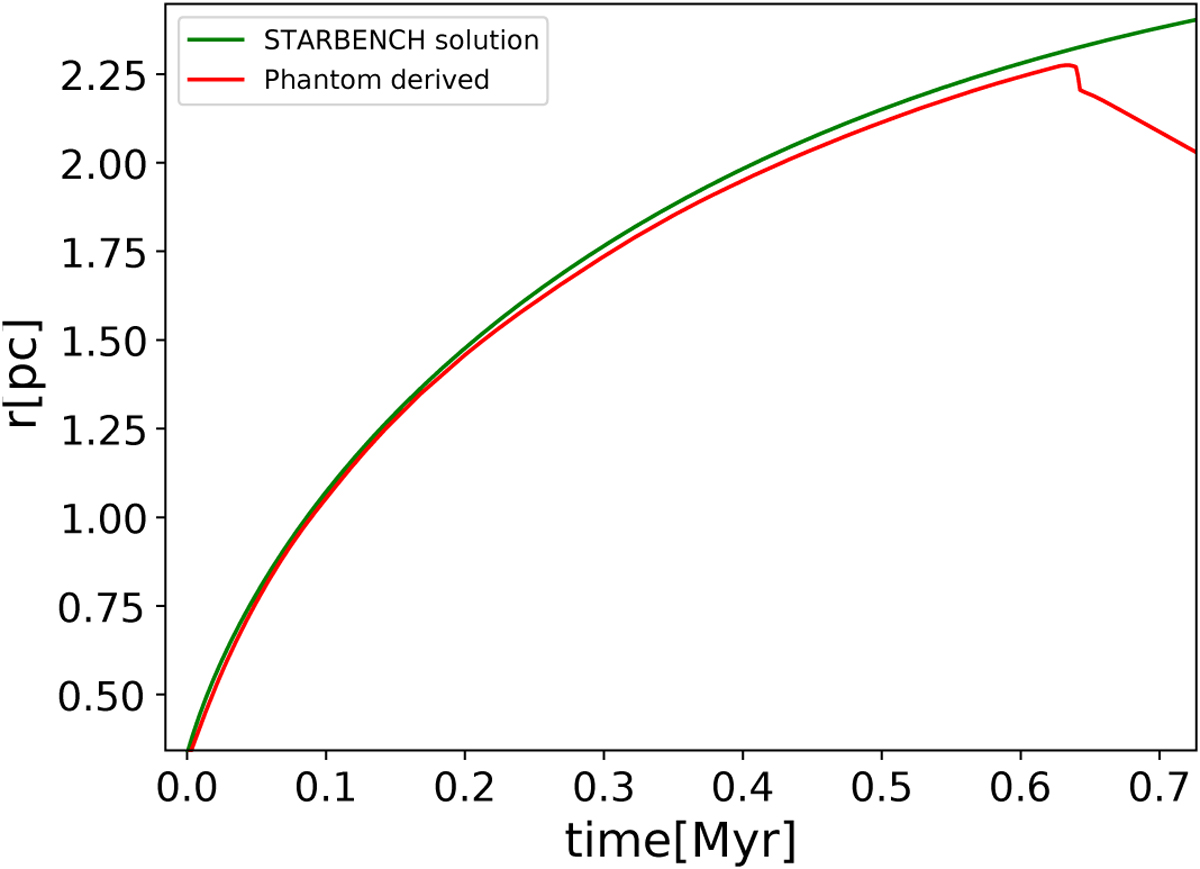
Time evolution of the HII region front radius. The green line is the analytical solution found in Bisbas et al. (2015). The red line is the Phantom-derived solution. The sudden drop after 0.6 Myr is due to the front shock reflection onto the boundary particles.
Current usage metrics show cumulative count of Article Views (full-text article views including HTML views, PDF and ePub downloads, according to the available data) and Abstracts Views on Vision4Press platform.
Data correspond to usage on the plateform after 2015. The current usage metrics is available 48-96 hours after online publication and is updated daily on week days.
Initial download of the metrics may take a while.