Fig. 6.
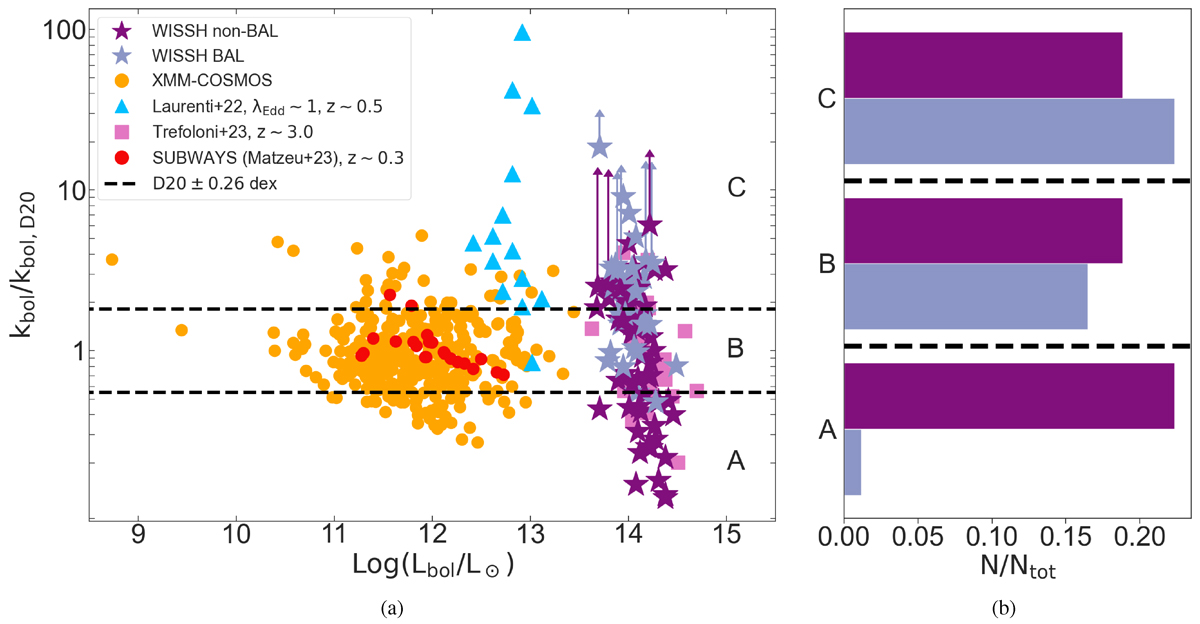
Download original image
(a) Ratio of measured kbol values to expected kbol values from D20 as a function of Log(Lbol). WISSH QSOs are compared to literature samples; the symbols are the same as in Figure 5. The two black dashed lines correspond to the 0.26 dex spread of D20 best fit to Type 1 sources. (b) Distribution of WISSH QSOs kbol with respect to the D20 relation, including its spread (black horizontal dashed lines), i.e. being below, within, or above it. BAL and non-BAL sources are represented as indigo and purple bars, respectively.
Current usage metrics show cumulative count of Article Views (full-text article views including HTML views, PDF and ePub downloads, according to the available data) and Abstracts Views on Vision4Press platform.
Data correspond to usage on the plateform after 2015. The current usage metrics is available 48-96 hours after online publication and is updated daily on week days.
Initial download of the metrics may take a while.