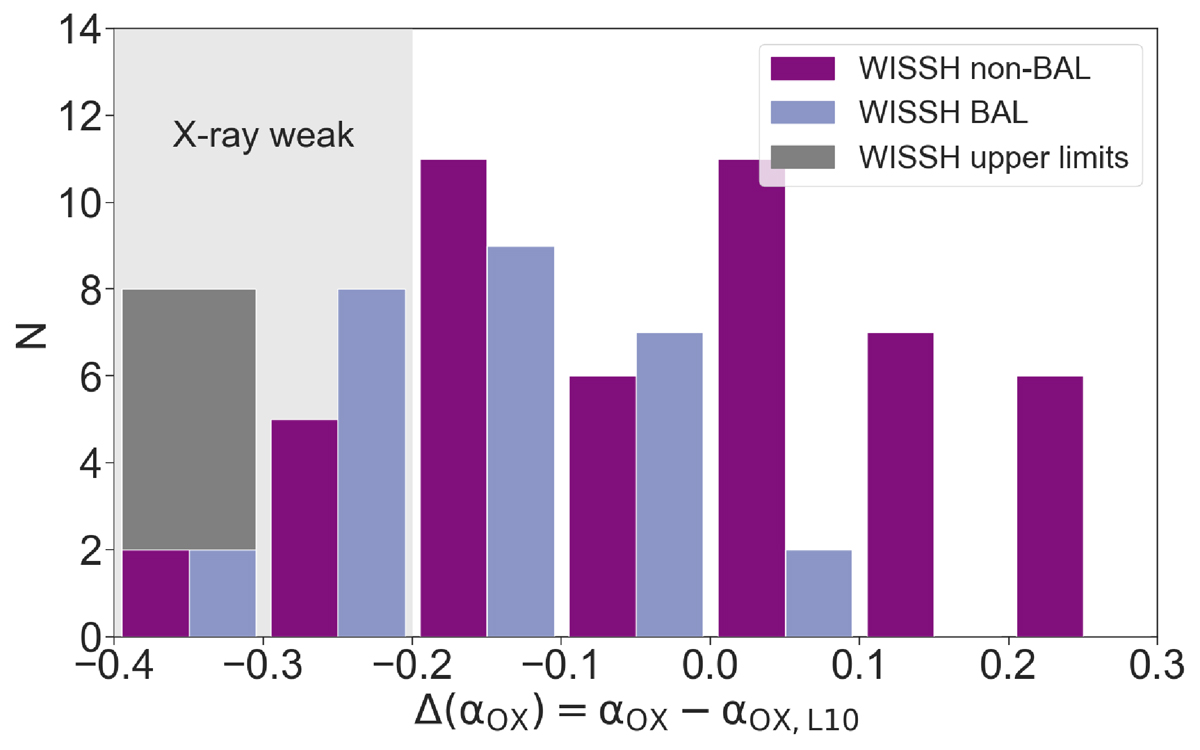
Fig. 8.
Download original image
Δ(αOX) = αOX − αOX, L10 distribution. αOX, L10 refers to the value derived from the L10 relation at a given L2500 Å. The BAL and non-BAL QSOs are represented as indigo and purple bars, respectively. The grey bar is for undetected sources, which have all been included in the X-ray-weakest bin. The grey-shaded area highlights the locus of X-ray-weak sources.
Current usage metrics show cumulative count of Article Views (full-text article views including HTML views, PDF and ePub downloads, according to the available data) and Abstracts Views on Vision4Press platform.
Data correspond to usage on the plateform after 2015. The current usage metrics is available 48-96 hours after online publication and is updated daily on week days.
Initial download of the metrics may take a while.