Fig. 10.
Download original image
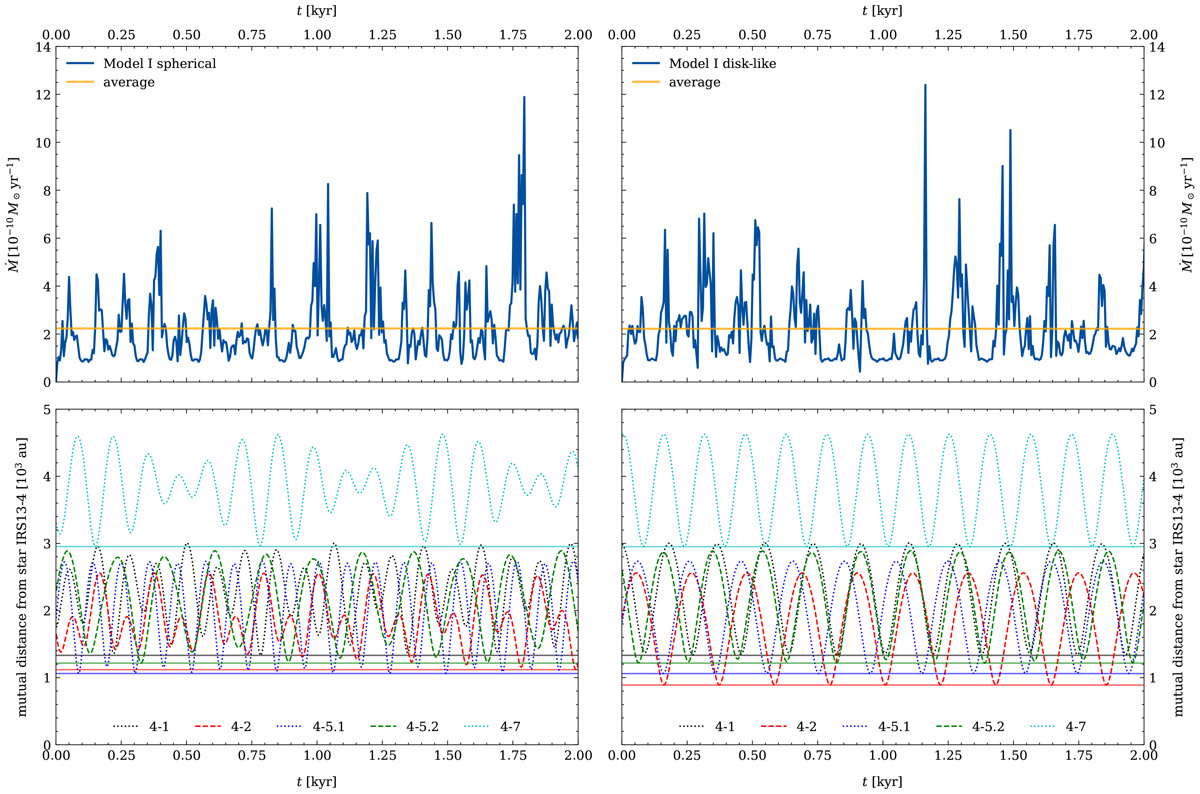
Temporal evolution of the mass inflow rate Ṁ (top row) and mutual distances between the shortest-period star E4 and other stars expressed in au (bottom row) for the isotropic spherical (left column) and disk-like (right column) stellar configurations. The minimum distances for each pair are represented via solid horizontal lines of corresponding color. In both configurations, periodic approaches between the closest star, E4, and all other stars are responsible for the periodic spikes in the inflow rate, with the shortest separations reaching ∼1000 au.
Current usage metrics show cumulative count of Article Views (full-text article views including HTML views, PDF and ePub downloads, according to the available data) and Abstracts Views on Vision4Press platform.
Data correspond to usage on the plateform after 2015. The current usage metrics is available 48-96 hours after online publication and is updated daily on week days.
Initial download of the metrics may take a while.