Fig. 11.
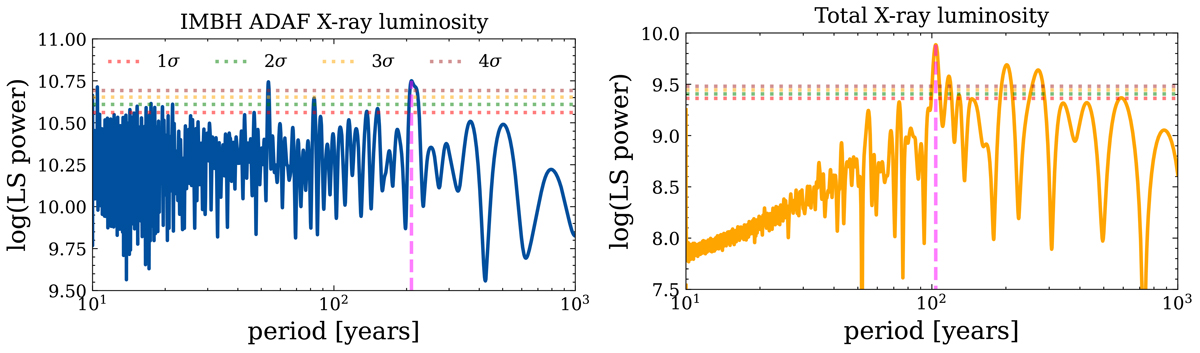
Download original image
Lomb–Scargle periodograms of the X-ray light curves computed from the simulations. Left: LS periodogram of the X-ray light curve produced by the near-horizon flow around the IMBH as calculated from an ADAF model. The highest peak is at ∼210 years, while other prominent peaks are at ∼54 and ∼83 years. The dotted horizontal lines mark inferred confidence levels based on 10 000 bootstrap realizations. Right: LS periodogram of the total X-ray luminosity exhibits the highest peak at ∼104 years. Other prominent peaks are at ∼202, ∼271, ∼55, and ∼74 years. The dotted horizontal lines stand for the confidence levels, as in the left panel.
Current usage metrics show cumulative count of Article Views (full-text article views including HTML views, PDF and ePub downloads, according to the available data) and Abstracts Views on Vision4Press platform.
Data correspond to usage on the plateform after 2015. The current usage metrics is available 48-96 hours after online publication and is updated daily on week days.
Initial download of the metrics may take a while.