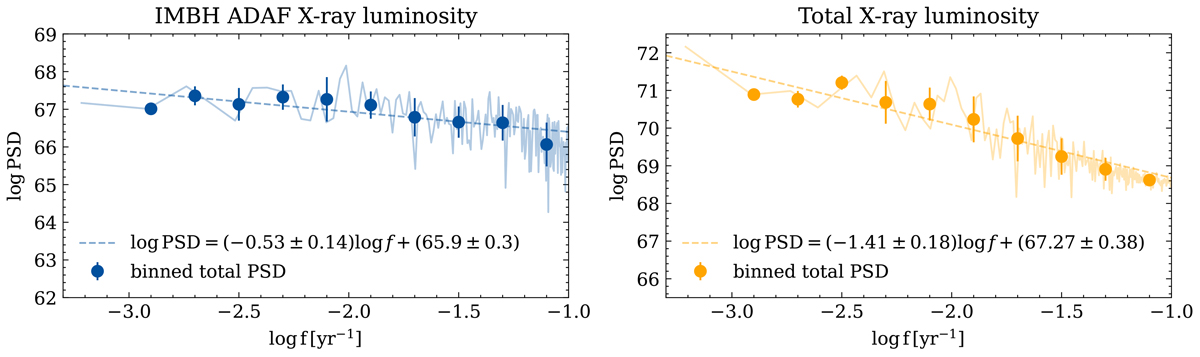
Fig. 12.
Download original image
Power spectral densities of the X-ray variability of the compact stellar cluster with an IMBH. Left: PSD of the X-ray light curve produced by the near-horizon flow around the IMBH as calculated from an ADAF model, which has a flat power-law slope of ∼ − 0.53. Right: PSD of the total X-ray light curve, which exhibits a steeper power-law slope of ∼ − 1.41. The points represent mean PSD values within the ten regular logarithmic bins in frequency, while the error bars represent standard deviations in these bins. We fit the power-law functions to these binned PSD values for consistency. In both panels, the extents of the logarithms of PSDs and frequencies are kept the same for consistency and easier comparison.
Current usage metrics show cumulative count of Article Views (full-text article views including HTML views, PDF and ePub downloads, according to the available data) and Abstracts Views on Vision4Press platform.
Data correspond to usage on the plateform after 2015. The current usage metrics is available 48-96 hours after online publication and is updated daily on week days.
Initial download of the metrics may take a while.