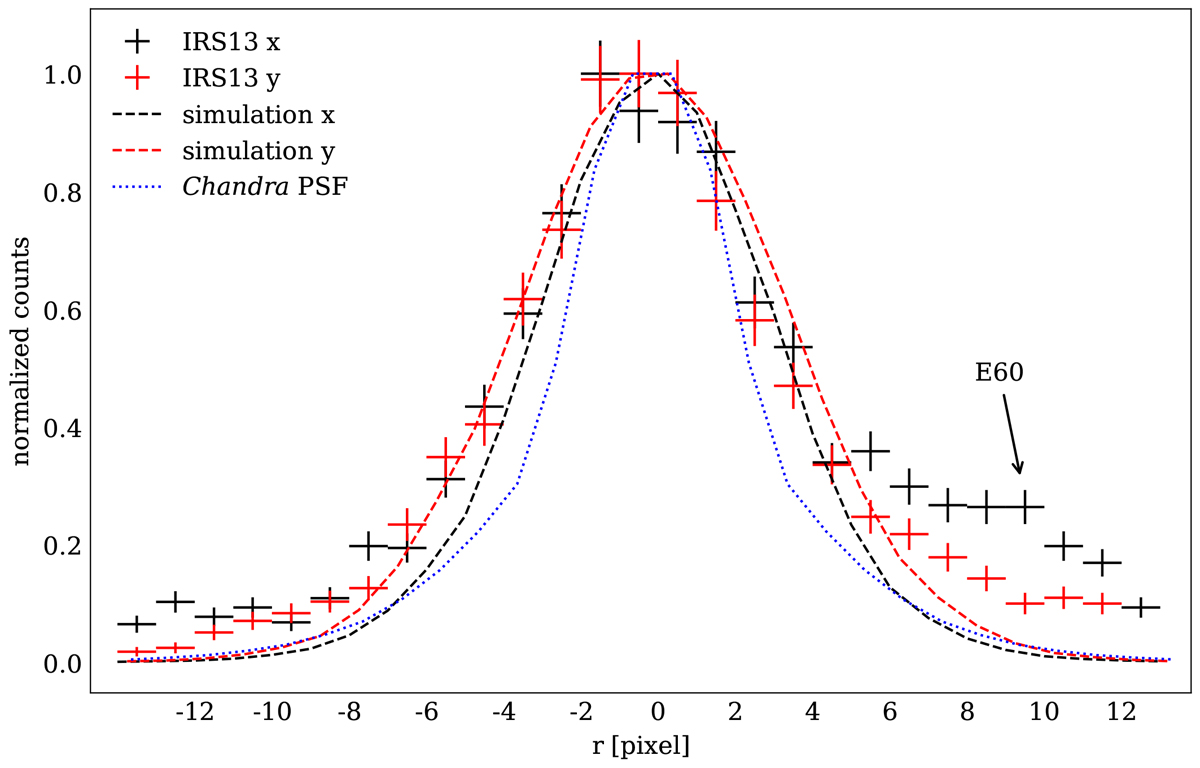
Fig. C.1.
Download original image
Comparison of the observed IRS 13E X-ray surface-brightness profiles (black and red points with errorbars in normalized units in two perpendicular directions x and y expressed in pixels) with the corresponding profiles inferred from simulations presented in this study (black and red dashed lines). A dotted blue line depicts the Chandra PSF. The more extended western wing of IRS 13E can be attributed to the E60 source. One pixel is equivalent to ∼0.125 arcsec or ∼5 × 10⁻³ pc at the Galactic center.
Current usage metrics show cumulative count of Article Views (full-text article views including HTML views, PDF and ePub downloads, according to the available data) and Abstracts Views on Vision4Press platform.
Data correspond to usage on the plateform after 2015. The current usage metrics is available 48-96 hours after online publication and is updated daily on week days.
Initial download of the metrics may take a while.