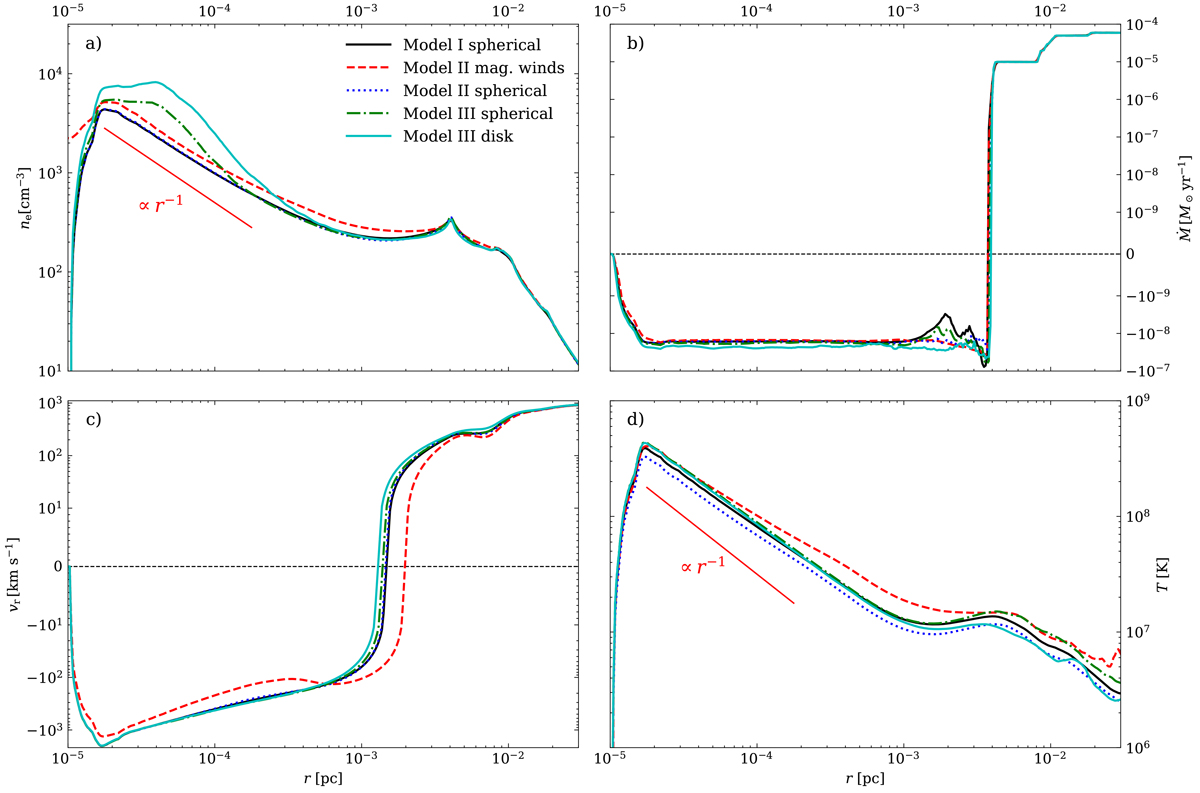
Fig. 3.
Download original image
Time and angle-averaged quantities in our simulations as a function of distance from the black hole, r. The different lines denote the different configurations of the simulation. (a) Density in the units of electron number density; (b) Accretion rate Ṁ; (c) Radial velocity of the gas vr; (d) Temperature of the gas. For the density and temperature radial profiles, a line representing ∝r−1 is also plotted for reference, highlighting the approximate power law in both quantities in the inner regions of the simulations.
Current usage metrics show cumulative count of Article Views (full-text article views including HTML views, PDF and ePub downloads, according to the available data) and Abstracts Views on Vision4Press platform.
Data correspond to usage on the plateform after 2015. The current usage metrics is available 48-96 hours after online publication and is updated daily on week days.
Initial download of the metrics may take a while.