Open Access
Fig. 4.
Download original image
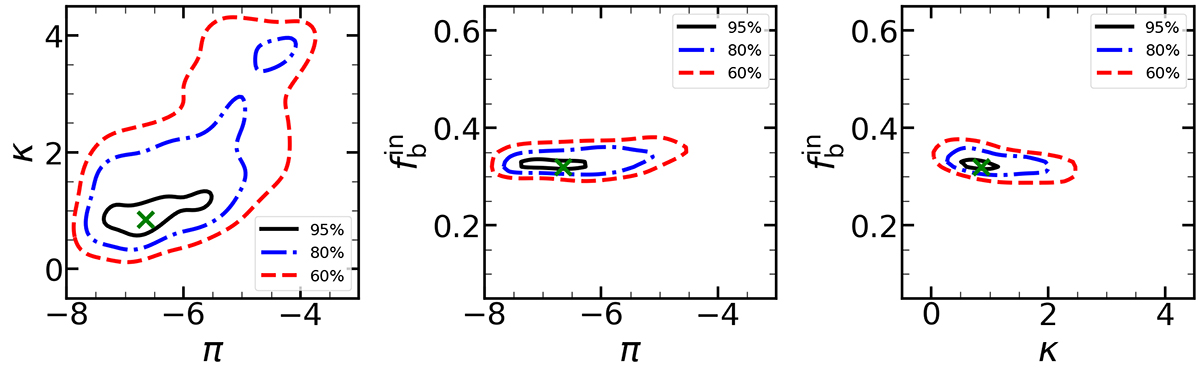
Projections of the GMF onto planes defined by different pairs of π, κ, and ![]() . The green cross (x) marks the position of the absolute maximum. The red, blue, green, and black contours indicate respectively regions of equal value corresponding to 60%, 80%, and 95% of the absolute maximum of the GMF.
. The green cross (x) marks the position of the absolute maximum. The red, blue, green, and black contours indicate respectively regions of equal value corresponding to 60%, 80%, and 95% of the absolute maximum of the GMF.
Current usage metrics show cumulative count of Article Views (full-text article views including HTML views, PDF and ePub downloads, according to the available data) and Abstracts Views on Vision4Press platform.
Data correspond to usage on the plateform after 2015. The current usage metrics is available 48-96 hours after online publication and is updated daily on week days.
Initial download of the metrics may take a while.