Fig. 1.
Download original image
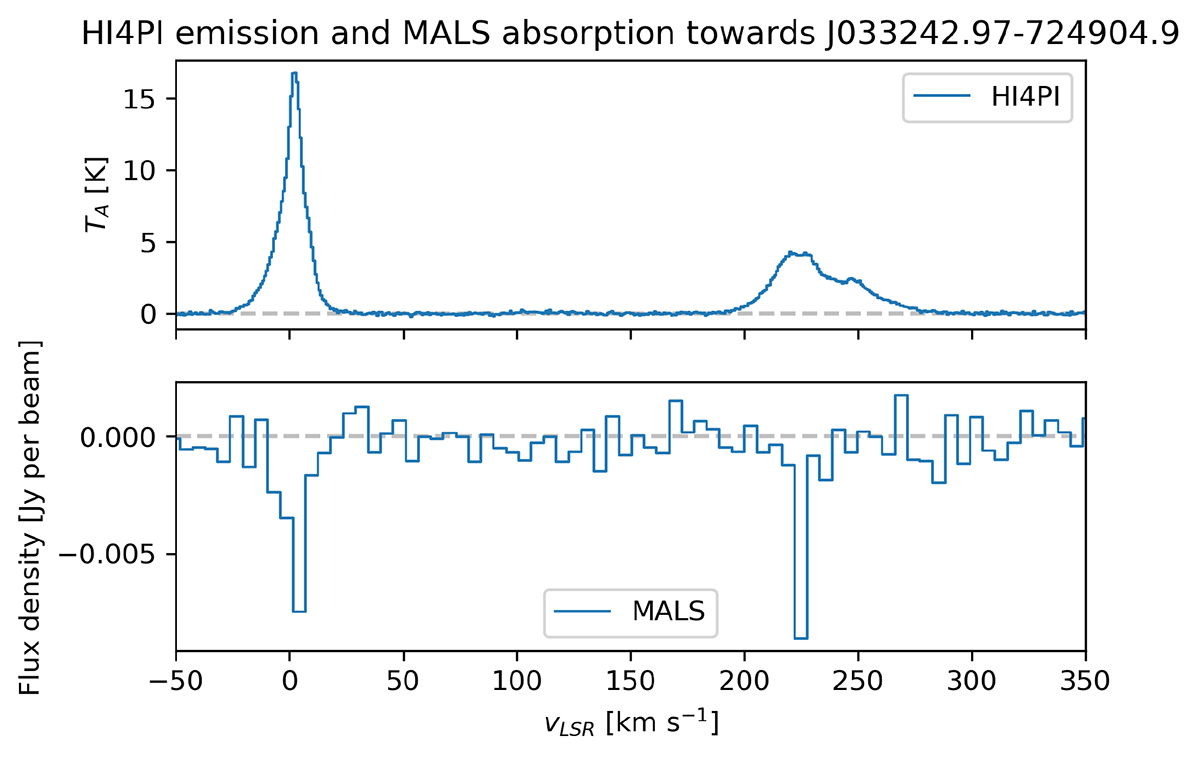
HI4PI emission and MALS absorption spectrum toward J0332-7249. Top: HI4PI H I spectrum with ΔvLSR = 1.28 km s−1 velocity resolution. Single-dish observations are sensitive to all H I gas phases.Bottom: Corresponding MALS absorption line spectrum with a coarser velocity resolution of ΔvLSR = 6.1 km s−1. Absorption line detection among the more dominant emission requires high angular resolution and is a tracer of cold and diffuse H I gas. The Gaussian decomposition components of both H I profiles are compiled in Tables A.1 and A.2, respectively.
Current usage metrics show cumulative count of Article Views (full-text article views including HTML views, PDF and ePub downloads, according to the available data) and Abstracts Views on Vision4Press platform.
Data correspond to usage on the plateform after 2015. The current usage metrics is available 48-96 hours after online publication and is updated daily on week days.
Initial download of the metrics may take a while.