| Issue |
A&A
Volume 702, October 2025
|
|
|---|---|---|
| Article Number | L11 | |
| Number of page(s) | 5 | |
| Section | Letters to the Editor | |
| DOI | https://doi.org/10.1051/0004-6361/202555015 | |
| Published online | 17 October 2025 | |
Letter to the Editor
Origin of gas in the Magellanic Bridge: MeerKAT detection of H I 21 cm absorption
1
Argelander-Institut für Astronomie, Auf dem Hügel 71, D-53121 Bonn, Germany
2
Inter-University Centre for Astronomy and Astrophysics, Post Bag 4, Ganeshkhind, Pune 411 007, India
3
Institut d’astrophysique de Paris, UMR 7095, CNRS, 98bis bd Arago, 75014 Paris, France
4
Ioffe Institute, 26 Politeknicheskaya st., St. Petersburg 194021, Russia
5
Departement of Astronomy and Astrophysics, The University of Chicago, Chicago, IL 60637, USA
6
Observatoire de Paris, Collège de France, PSL University, Sorbonne University, CNRS, LUX, Paris, France
7
National Radio Astronomy Observatory, 520 Edgemont Road, Charlottesville, VA 22903, USA
8
National Radio Astronomy Observatory, 1011 Lopezville Road, Socorro, NM 87801, USA
⋆ Corresponding author: This email address is being protected from spambots. You need JavaScript enabled to view it.
Received:
2
April 2025
Accepted:
23
September 2025
Abstract
Aims. H I 21 cm absorption lines are investigated to determine the origin of the neutral atomic hydrogen (H I) of the Magellanic Bridge (MB). Using MeerKat Absorption Line Survey (MALS) data, we report the detection of an H I absorption line at a peak signal-to-noise ratio (S/N) of 10 caused by MB gas observed against the radio source J033242.97-724904.5. In combination with earlier data obtained with the Australia Telescope Compact Array (ATCA), our new detected H I line enables the exploration of the MB atomic hydrogen gas across 4–6 kpc.
Methods. We investigated the radial velocity profiles from the ATCA data and included new data from MALS in the analysis. Apart from the excitation conditions, we considered the radial velocity structure of the H I gas seen in emission and absorption. The gas-to-dust ratio was quantified to help identify whether the MB gas had originated from the SMC (Small Magellanic Cloud) or the LMC (Large Magellanic Cloud).
Results. The H I absorption lines toward lines of sight separated by a few kiloparsecs consistently coincide with the densest and possibly the coolest gas at the lower radial-velocity limit of the corresponding H I emission profiles. The gas-to-dust ratio was found to be consistent with the MB gas originating in the LMC. The large-scale velocity distribution, as seen from the H I absorption features, favors the LMC-SMC direct collision scenario over the close fly-by scenario, which is also supported by results from recent numerical simulations.
Key words: instrumentation: interferometers / surveys / ISM: atoms / galaxies: dwarf / galaxies: interactions / Magellanic Clouds
© The Authors 2025
 Open Access article, published by EDP Sciences, under the terms of the Creative Commons Attribution License (https://creativecommons.org/licenses/by/4.0), which permits unrestricted use, distribution, and reproduction in any medium, provided the original work is properly cited.
This article is published in open access under the Subscribe to Open model. This email address is being protected from spambots. You need JavaScript enabled to view it. to support open access publication.
1. Introduction
The Magellanic Cloud System (MCS) is the closest extragalactic laboratory for studying structure formation on galactic scales. It also offers a rare opportunity in extragalactic science to measure the proper motions of galaxy pairs (Zivick et al. 2018, and references therein). Currently, two models are competing to explain the formation of the MB: (a) a close flyby (Besla et al. 2012) or (b) a direct collision (e.g., Besla et al. 2012; Belokurov et al. 2018; Zivick et al. 2018). While the gaseous morphology of observed structures may not be straightforward to interpret, the physical conditions of the neutral gas provide insights into its formation history. Here, we present a recently identified H I 21 cm absorption line observed, part of the MeerKAT Absorption Line Survey (MALS; Gupta et al. 2016), toward the Magellanic Bridge (MB), connecting the LMC and the SMC via its H I emission. It complements information obtained by earlier investigations by Kobulnicky & Dickey (1999). The MALS line of sight toward the quasar J033242.97–724904.51 (l = 288 589394, b = –39
 500745) presented here probes the MB gas away from the leading edge probed by B0312-770 and B0202-765 (Kobulnicky & Dickey 1999).
Due to its very low rate of spontaneous emission, the H I 21 cm line is a unique probe of the density structure and kinematics of the atomic ISM. Investigating the H I 21 cm line simultaneously in emission and absorption reveals the excitation conditions, as well as the relative fraction of cold and warm neutral atomic gas along a line of sight. The observations are carried out toward a luminous extragalactic background source, sufficiently bright to outshine the H I line in emission.
The population of the hyperfine (F = 1) upper level in the hydrogen atom relative to the ground state (F = 0) is defined by the spin temperature TSpin (Field 1959), which can be measured as
 (1)
(1)
Here, NHI is in cm−2, Tspin in K, and the velocity interval dv in km s−1. The measured optical depth, τ, of the absorption depends mainly on two quantities: the column density, NHI, and the spin temperature, TSpin, i.e., τ ∝  . In the cold phase, the density could be sufficient to drive through collisions, TSpin, toward the kinetic temperature of the gas, i.e., TSpin ∼ TK; whereas in the warmer atomic gas, we see TSpin < TK (Liszt 2001). Generally, the quantity TSpin derived from the observables represents the column density weighted mean of the spin temperatures along the line of sight (e.g., Kulkarni et al. 1988). The full width at half maximum (FWHM) of the line is related to the Doppler temperature (TD) of the gas, expressed as TD =
  = 21.866 × Δv2[K], with Δv in units of km s−1 for the hydrogen mass, mH, andBoltzmann’s constant, kB (Payne et al. 1980).
In most spectra, the line width is attributed to streaming and turbulent motions, broadening the line well beyond the thermal contribution, and with TD ≫ TK. In particular, toward the Galactic Plane, the line of sight can be used to probe blended multiple, unrelated physical structures. In the case of MCS, tidal forces tend to separate the different velocity components across the sky, reducing the complexity along the line of sight (Brüns et al. 2005).
In our analysis, we evaluated H I 21 cm absorption lines (resolution∼10″) toward the MB from MALS and H I 21 cm emission line information extracted from the HI4PI survey (resolution  ; HI4PI Collaboration 2016). Previously, Kobulnicky & Dickey (1999) found TSpin to vary appreciably (50–150 K) across the MB. We adopted a distance of 50 kpc for the Magellanic System (de Grijs et al. 2014). From the associated metallicity, the H I 21 cm line will provide insights into the formation history of the MCS.
2. Observations and data analysis
We observed the field centered at J0332-7249 using 60 antennas of the MeerKAT-64 array on 2021 January 18. We used the 32K mode of the SKA Reconfigurable Application Board (SKARAB) correlator to split the total bandwidth of 856 MHz centered at 1283.9869 MHz into 32768 frequency channels. The resultant frequency resolution is 26.123 kHz, or 5.5 km s−1, at the H I 21 cm line frequency.
The total on-source time on J0332-7249 was 56 mins. For the Galactic H I 21 cm line analysis, we generated a measurement set comprising only XX and YY polarization products over 400 frequency channels centered at 1420.2709 MHz in the “topocentric” frame. These data were processed using the Automated Radio Telescope Imaging Pipeline (ARTIP; Gupta et al. 2021) based on NRAO’s Common Astronomy Software Applications (CASA) package (CASA et al. 2022). The details of Galactic spectral line processing and line search are provided in Gupta et al. (2025). The peak flux density of the unresolved continuum source is 244.1 mJy beam−1. The unsmoothed spectrum, extracted at the pixel corresponding to the peak flux density of the radio source, has an rms noise of 0.8 mJy beam−1.
3. Results
The MALS H I 21 cm absorption line spectrum of J0332-7249, along with the corresponding H I emission line from HI4PI, are presented in Fig. 1. Kobulnicky & Dickey (1999) observed eight sight lines: five probing the outskirts of the MCS and three probing the MB, using the Australia Telescope Compact Array (ATCA). Their final ATCA spectral image cube was characterized by a high spectral resolution (0.82 km s−1 channel separation). The two sight lines, namely B0202-765 and B0312-770, probing MB toward the leading edge of the MCS, are detected in H I 21 cm absorption (see Fig. 2). J0332-7249 probes a different location in the MB: it is halfway between the SMC and the LMC, where the column density, NHI, is twice that of B0202-765 and B0312-770, with a higher mean radial velocity. The H I emission line in all three cases shows two prominent peaks and the H I absorption feature overlaps with the lower radial velocity component. The ATCA absorption profile exhibits multiple narrow distinct H I features, possibly due to an improved spectral resolution.
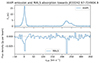 |
Fig. 1. HI4PI emission and MALS absorption spectrum toward J0332-7249. Top: HI4PI H I spectrum with ΔvLSR = 1.28 km s−1 velocity resolution. Single-dish observations are sensitive to all H I gas phases.Bottom: Corresponding MALS absorption line spectrum with a coarser velocity resolution of ΔvLSR = 6.1 km s−1. Absorption line detection among the more dominant emission requires high angular resolution and is a tracer of cold and diffuse H I gas. The Gaussian decomposition components of both H I profiles are compiled in Tables A.1 and A.2, respectively. |
Table A.2 compiles the Gaussian fit details of three Gaussian components in the H I emission profile toward J0332-7249 by Kalberla & Haud (2018). Two of them are centered within a single spectra channel of 1.28 km s−1 width at vLSR ≃ 219.1 km s−1 and vLSR ≃ 219.6 km s−1, respectively. The third one is positioned at slightly higher radial velocity of vLSR ≃ 228.3 km s−1. All three sum up to a column density of NHI(J0332) = (1.18 ± 0.07)×1020 cm−2. Because we cannot determine the individual contribution of the emission profiles to the absorption feature observed based solely on the emission line data, we applied a column density weighting to estimate the spin temperature. Using Eq. (1), we calculated TSpin(MB) = 69 ± 11 K. This value is in between the spin temperature determined by Kobulnicky & Dickey (1999) for the lines of sight through the MB toward B0202-765 and B0312-770.
There are certain limitations inherent to this analysis due to the quantitative correlation of Parkes 64-m single-dish H I emission data and interferometric absorption line data with different spatial resolutions, from arcsec to 16.2 arcmin, probing different physical gas volumes. Accordingly, our estimated spin temperature for the MB is systematically biased to lower or higher values.
The coincidence between the lower velocity component in H I emission and absorption implies that the atomic gas is denser at these velocities (vLSR ≃ 219 km s−1). Notably, the presence of two prominent velocity components in H I emission toward the line of sight in Fig. 1 is not unique, but a common feature throughout the whole MCS. It is also known that the gas with vLSR ≃ 180 km s−1 has a lower radial velocity than that of the LMC at vLSR ≃ 280 km s−1 (Brüns et al. 2005, their Fig. 3).
Muller et al. (2004) subdivided the MB into four quadrants: two northern ones ranging from (J2000) RA ≈ 1h30m to 3h45m and Dec. ≈ −73° to −71°, along with two southern quadrants at the same RA, but with declinations from Dec. ≈ −75° to −73°. They calculated the spatial power spectrum (SPS) and the spectral correlation function (SCF) for the northern and southern quadrants separately and found that the northern parts appear distinct from the southern parts and from the SMC: the northern parts have an SPS significantly more affected by slower velocity perturbations. They concluded that the MB may not be considered a single contiguous feature, but a projection of two kinematically and morphologically distinct structures. Furthermore, they found that the southern region of the MB and the SMC are similar and that the SPS and SCF of the MB have power-law indices compatible to those found by Padoan et al. (2001) for the LMC.
Besla et al. (2012) and Zivick et al. (2018) proposed that the MB was caused by a direct collision of SMC and LMC (Besla’s+ model 2), where the SMC passed through the LMC about 147 ± 33 Myr ago (Zivick et al. 2018). Moreover, Zivick et al. (2018) favored Model 2 because the observations by Harris (2007) of in situ star formation in the MB led to the conclusion that the stripped material forming the MB was a nearly pure gas. In addition, the proper motions of the MB stars are seen to track the motion of the SMC toward the LMC. Further evidence for Model 2 comes from Choi et al. (2018), who found a tidally induced warp in the LMC and concluded that such a warp could only have been created through a direct collision. A two-component radial velocity structure of the H I gas is consistent with this interaction hypothesis, according to which the gas of the LMC forms major parts of the MB (Besla et al. 2012).
The gas-to-dust ratio differs greatly (Roman-Duval et al. 2014; Welty et al. 2012; Koornneef 1982) for the SMC and LMC. Following (Sasaki et al. 2022, their Sect. 2.2), we separated the Milky Way and MCS dust emission to constrain the origin of the MB gas seen in H I absorption. To that aim, we adopted their gas-to-dust ratio of ![Mathematical equation: $ \frac{N_{\mathrm{H}}}{E\mathrm{(B-V)}}=(0.63\pm0.05)\times 10^{22}\left[\frac{\mathrm{cm}^{-2}}{\mathrm{mag}}\right] $](/articles/aa/full_html/2025/10/aa55015-25/aa55015-25-eq10.gif) and multiplied that median value with the H I map of the Milky Way column density distribution of HI4PI (Sasaki et al. 2022, their Fig. 2). The difference map between the original Schlegel et al. (1998, SFD) map, and the one modeling the optical extinction of the Milky Way is displayed in Fig. 2. The lowest contour line displayed marks regions two times the Milky Way median value. This contour line encircles the entire MCS system. The highest contour line of five times the median Milky Way value is uniquely reached toward the SMC, in agreement with both Welty et al. (2012) and Koornneef (1982). The H I absorption lines detected by Kobulnicky & Dickey (1999) and here (black and white circles, respectively) are directed toward gas volumes with a gas-to-dust ratio compatible with the outskirts of the LMC.
and multiplied that median value with the H I map of the Milky Way column density distribution of HI4PI (Sasaki et al. 2022, their Fig. 2). The difference map between the original Schlegel et al. (1998, SFD) map, and the one modeling the optical extinction of the Milky Way is displayed in Fig. 2. The lowest contour line displayed marks regions two times the Milky Way median value. This contour line encircles the entire MCS system. The highest contour line of five times the median Milky Way value is uniquely reached toward the SMC, in agreement with both Welty et al. (2012) and Koornneef (1982). The H I absorption lines detected by Kobulnicky & Dickey (1999) and here (black and white circles, respectively) are directed toward gas volumes with a gas-to-dust ratio compatible with the outskirts of the LMC.
The gas-to-dust ratio of the LMC as reported by Koornneef (1982) based on the International Ultraviolet Explorer data is NHI/E(B − V) = (2 ± 0.5)×1022 cm−2 mag−1. Welty et al. (2012) used the Hubble Space Telescope and Far Ultraviolet Spectroscopic Explorer data to estimate NH/E(B − V) = (1.5–1.7)×1022 cm−2 mag−1 and NHI/E(B − V) = (1.5–1.6)×1022 cm−2 mag−1 as average values for the LMC. Our estimate toward J0332-7249 is closer to the LMC value and less compatible with the average value of NH/E(B − V) = (2.3–3.0)×1022 cm−2 mag−1 for the SMC (Welty et al. 2012). Toward J0332-7249, we found the following results for the MCS gas-to-dust ratio: NHI/E(B − V) = (1.29 ± 0.04(stat)±0.17(sys)) ⋅ 1022 cm−2 mag−1 (see Fig. 2). This value is compatible with the hypothesis that the detected MALS H I absorption line is associated with the LMC gas.
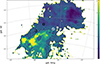 |
Fig. 2. Gas-to-dust ratio of the MCS in units of the Milky Way’s median value of |
According to Model 2 of Besla et al. (2012), the more metal-rich gas from LMC might also have ended up in the MB. This scenario would result in a gradient of increasing metallicity toward the LMC. The gas-to-dust ratio at 50 locations along the MB and the two measurements from Koornneef (1982) and Welty et al. (2012) are displayed in Fig. 2. The large drops at both ends of the latitude and longitude ranges correspond to the centers of the LMC and the SMC. Indeed, as we would expect from Model 2, there is a gradient of decreasing gas-to-dust ratio starting from the SMC Wenger et al. (2000,  ,
,  ) toward the LMC (
 ,
,  ; Wenger et al. 2000). For the trend with longitude, the gas-to-dust ratio of the LMC extends clearly further than the Magellanic Cloud itself (Welty et al. 2012), which has a radius of about 5°.
The gas detected in H I absorption exhibits a coherent structure in radial velocity across at least 4-6 kpc. Adopting a rather high relative velocity of about 100 km s−1 (Brüns et al. 2005, their Fig. 3), it should have taken about 40 million years for the gas to move across these distances. Over this time period, the gas would have reached some kind of equilibrium with its environment, allowing us to estimate the pressure within the MB. Toward J0332-7249, observed with the Parkes beam of 16.2 arcmin in diameter, the average column density is NHI = 7.75 × 1020 cm−2. At the adopted distance of 50 kpc (de Grijs et al. 2014) the Parkes beam corresponds to 235 pc or 7.2 × 1020 cm. Assuming a depth of the gaseous layer comparable to the width, we can derive an average volume density in the MB of about nHI ≃ 1 cm−3. The line width from Gaussian decomposition yields a Doppler temperature of TD = 857 ± 29 K, setting an upper limit to the kinetic temperature. The average gas pressure has then an upper limit of PK ∼ 900 K cm−3. Wang et al. (2019) deduced an environmental volume density of about nMW ≃ 2 − 3 × 10⁻⁴ cm−3 (their Fig. 1, bottom panel) to account for the observed density and radial–velocity structure of the MCS. To enable a pressure equilibrium between this ambient coronal plasma and the H I clouds presented here, the plasma needs to be very hot, at about THalo ∼ 2 × 10⁶ K. We note that this hot, thin plasma gas has been observed by Sasaki et al. (2022). Notably, the values (P = n kTkin(HI), nH, TMW) discussed above are consistent with three independent studies on the morphology of the MCS, the H I data of Kobulnicky & Dickey (1999), and the findings presented here as well as reports from soft X-ray studies.
4. Conclusions
We report the detection of an H I 21 cm absorption line associated with the MB toward the MALS sightline J0332-7249. In combination with the two H I absorption lines detected by Kobulnicky & Dickey (1999), these data enabled us to probe the average gas volumic density of the MB over 4–6 kpc. Despite the kpc-scale separation, all three absorption lines show that the cold dense gas traced by H I absorption is at the low radial velocity part of the corresponding H I emission profile, a common feature of the gas associated with the MB. All H I 21 cm emission profiles reveal a two-component structure in velocity space. The absorbing gas consistently coincides with a higher peaked, narrower H I emission line component at lower radial velocities, implying cold and dense gas. This also suggests that the gas is decelerated by ram pressure from the Milky Way’s halo plasma across linear scales of several kpc. There might also be some gas exchange between the two MCS galaxies taking place as well. The derived spin temperature of TS = 104 ± 20 K is consistent with the range of temperatures derived by Kobulnicky & Dickey (1999). The similarity between the MB gas-to-dust ratio and that of the LMC (rather than the SMC) supports the notion that the MB gas originated in the LMC. The SMC’s gas-to-dust ratio is far higher, implying that the MB gas was extracted from the LMC. According to Zivick et al. (2018) and Besla et al. (2012), the direct collision scenario of the SMC and LMC is currently favored, further supported by our 21 cm study.
Hereafter, referred as J0332-7249.
Acknowledgments
We thank an anonymous referee for very constructive critics and suggestions significantly improving the presentation. The MeerKAT telescope is operated by the South African Radio Astronomy Observatory, which is a facility of the National Research Foundation, an agency of the Department of Science and Innovation. The MeerKAT data were processed using the MALS computing facility at IUCAA (https://mals.iucaa.in/releases). NG acknowledges NRAO for generous financial support for the sabbatical visit at Socorro during which a part of this work was done. The National Radio Astronomy Observatory is a facility of the National Science Foundation operated under cooperative agreement by Associated Universities, Inc. We thank an anonymous referee for very constructive critics and suggestions significantly improving the presentation. The MeerKAT telescope is operated by the South African Radio Astronomy Observatory, which is a facility of the National Research Foundation, an agency of the Department of Science and Innovation. The MeerKAT data were processed using the MALS computing facility at IUCAA (https://mals.iucaa.in/releases). NG acknowledges NRAO for generous financial support for the sabbatical visit at Socorro during which a part of this work was done. The National Radio Astronomy Observatory is a facility of the National Science Foundation operated under cooperative agreement by Associated Universities, Inc.
References
- AIfA H I Surveys Data Server 2024, H2 and H all-sky column density maps from HI4PI Gaussians https://www.astro.uni-bonn.de/hisurvey/HI4PI_gauss_HPX/ [Google Scholar]
- Belokurov, V., Erkal, D., Evans, N. W., Koposov, S. E., & Deason, A. J. 2018, MNRAS, 478, 611 [Google Scholar]
- Besla, G., Kallivayalil, N., Hernquist, L., et al. 2012, MNRAS, 421, 2109 [Google Scholar]
- Brüns, C., Kerp, J., Staveley-Smith, L., et al. 2005, A&A, 432, 45 [CrossRef] [EDP Sciences] [Google Scholar]
- CASA, T., Bean, B., Bhatnagar, S., et al. 2022, PASP, 134, 114501 [NASA ADS] [CrossRef] [Google Scholar]
- Choi, Y., Nidever, D. L., Olsen, K., et al. 2018, ApJ, 866, 90 [Google Scholar]
- de Grijs, R., Wicker, J. E., & Bono, G. 2014, AJ, 147, 122 [Google Scholar]
- Field, G. B. 1959, ApJ, 129, 536 [Google Scholar]
- Gupta, N., Srianand, R., Baan, W., et al. 2016, MeerKAT Science: On the Pathway to the SKA, 14 [Google Scholar]
- Gupta, N., Kerp, J., Balashev, S. A., et al. 2025, A&A, 698, A120 [NASA ADS] [CrossRef] [EDP Sciences] [Google Scholar]
- Harris, J. 2007, ApJ, 658, 345 [Google Scholar]
- HI4PI Collaboration (Ben Bekhti, N., et al.) 2016, A&A, 594, A116 [NASA ADS] [CrossRef] [EDP Sciences] [Google Scholar]
- Kalberla, P. M. W., & Haud, U. 2018, A&A, 619, A58 [NASA ADS] [CrossRef] [EDP Sciences] [Google Scholar]
- Kobulnicky, H. A., & Dickey, J. M. 1999, AJ, 117, 908 [Google Scholar]
- Koornneef, J. 1982, A&A, 107, 247 [NASA ADS] [Google Scholar]
- Kulkarni, S. R., & Heiles, C. 1988, in Galactic and Extragalactic Radio Astronomy, eds. K. I. Kellermann, & G. L. Verschuur (Springer-Verlag), 95 [Google Scholar]
- Liszt, H. 2001, A&A, 371, 698 [NASA ADS] [CrossRef] [EDP Sciences] [Google Scholar]
- Muller, E., Stanimirović, S., Rosolowsky, E., & Staveley-Smith, L. 2004, ApJ, 616, 845 [Google Scholar]
- Padoan, P., Kim, S., Goodman, A., & Staveley-Smith, L. 2001, ApJ, 555, L33 [Google Scholar]
- Payne, H. E., Salpeter, E. E., & Terzian, Y. 1980, ApJ, 240, 499 [NASA ADS] [CrossRef] [Google Scholar]
- Roman-Duval, J., Gordon, K. D., Meixner, M., et al. 2014, ApJ, 797, 86 [NASA ADS] [CrossRef] [Google Scholar]
- Sasaki, M., Knies, J., Haberl, F., et al. 2022, A&A, 661, A37 [NASA ADS] [CrossRef] [EDP Sciences] [Google Scholar]
- Schlegel, D. J., Finkbeiner, D. P., & Davis, M. 1998, AJ, 500, 525 [NASA ADS] [CrossRef] [Google Scholar]
- Wang, J., Hammer, F., Yang, Y., et al. 2019, MNRAS, 486, 5907 [CrossRef] [Google Scholar]
- Welty, D. E., Xue, R., & Wong, T. 2012, ApJ, 745, 173 [NASA ADS] [CrossRef] [Google Scholar]
- Wenger, M., Ochsenbein, F., Egret, D., et al. 2000, A&AS, 143, 9 [NASA ADS] [CrossRef] [EDP Sciences] [Google Scholar]
- Zivick, P., Kallivayalil, N., van der Marel, R. P., et al. 2018, ApJ, 864, 55 [Google Scholar]
Appendix A: Gaussian decomposition of emission and absorption lines
H I emission lines and Gaussian fits.
Details of Gaussian fits to absorption lines toward J0332-7249 with a single Gaussian fit.
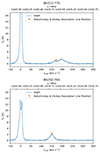 |
Fig. A.1. HI4PI emission spectra from the AIfA H I Surveys Data Server (2024) toward B0312-770 and B0202-765 at which Kobulnicky & Dickey (1999) detected absorption lines. The velocity component of the absorption line with the highest column density is marked with an orange triangle. |
All Tables
Details of Gaussian fits to absorption lines toward J0332-7249 with a single Gaussian fit.
All Figures
|
Fig. 1. HI4PI emission and MALS absorption spectrum toward J0332-7249. Top: HI4PI H I spectrum with ΔvLSR = 1.28 km s−1 velocity resolution. Single-dish observations are sensitive to all H I gas phases.Bottom: Corresponding MALS absorption line spectrum with a coarser velocity resolution of ΔvLSR = 6.1 km s−1. Absorption line detection among the more dominant emission requires high angular resolution and is a tracer of cold and diffuse H I gas. The Gaussian decomposition components of both H I profiles are compiled in Tables A.1 and A.2, respectively. |
| In the text | |
|
Fig. 2. Gas-to-dust ratio of the MCS in units of the Milky Way’s median value of |
| In the text | |
|
Fig. A.1. HI4PI emission spectra from the AIfA H I Surveys Data Server (2024) toward B0312-770 and B0202-765 at which Kobulnicky & Dickey (1999) detected absorption lines. The velocity component of the absorption line with the highest column density is marked with an orange triangle. |
| In the text | |
Current usage metrics show cumulative count of Article Views (full-text article views including HTML views, PDF and ePub downloads, according to the available data) and Abstracts Views on Vision4Press platform.
Data correspond to usage on the plateform after 2015. The current usage metrics is available 48-96 hours after online publication and is updated daily on week days.
Initial download of the metrics may take a while.