Open Access
Fig. A.1.
Download original image
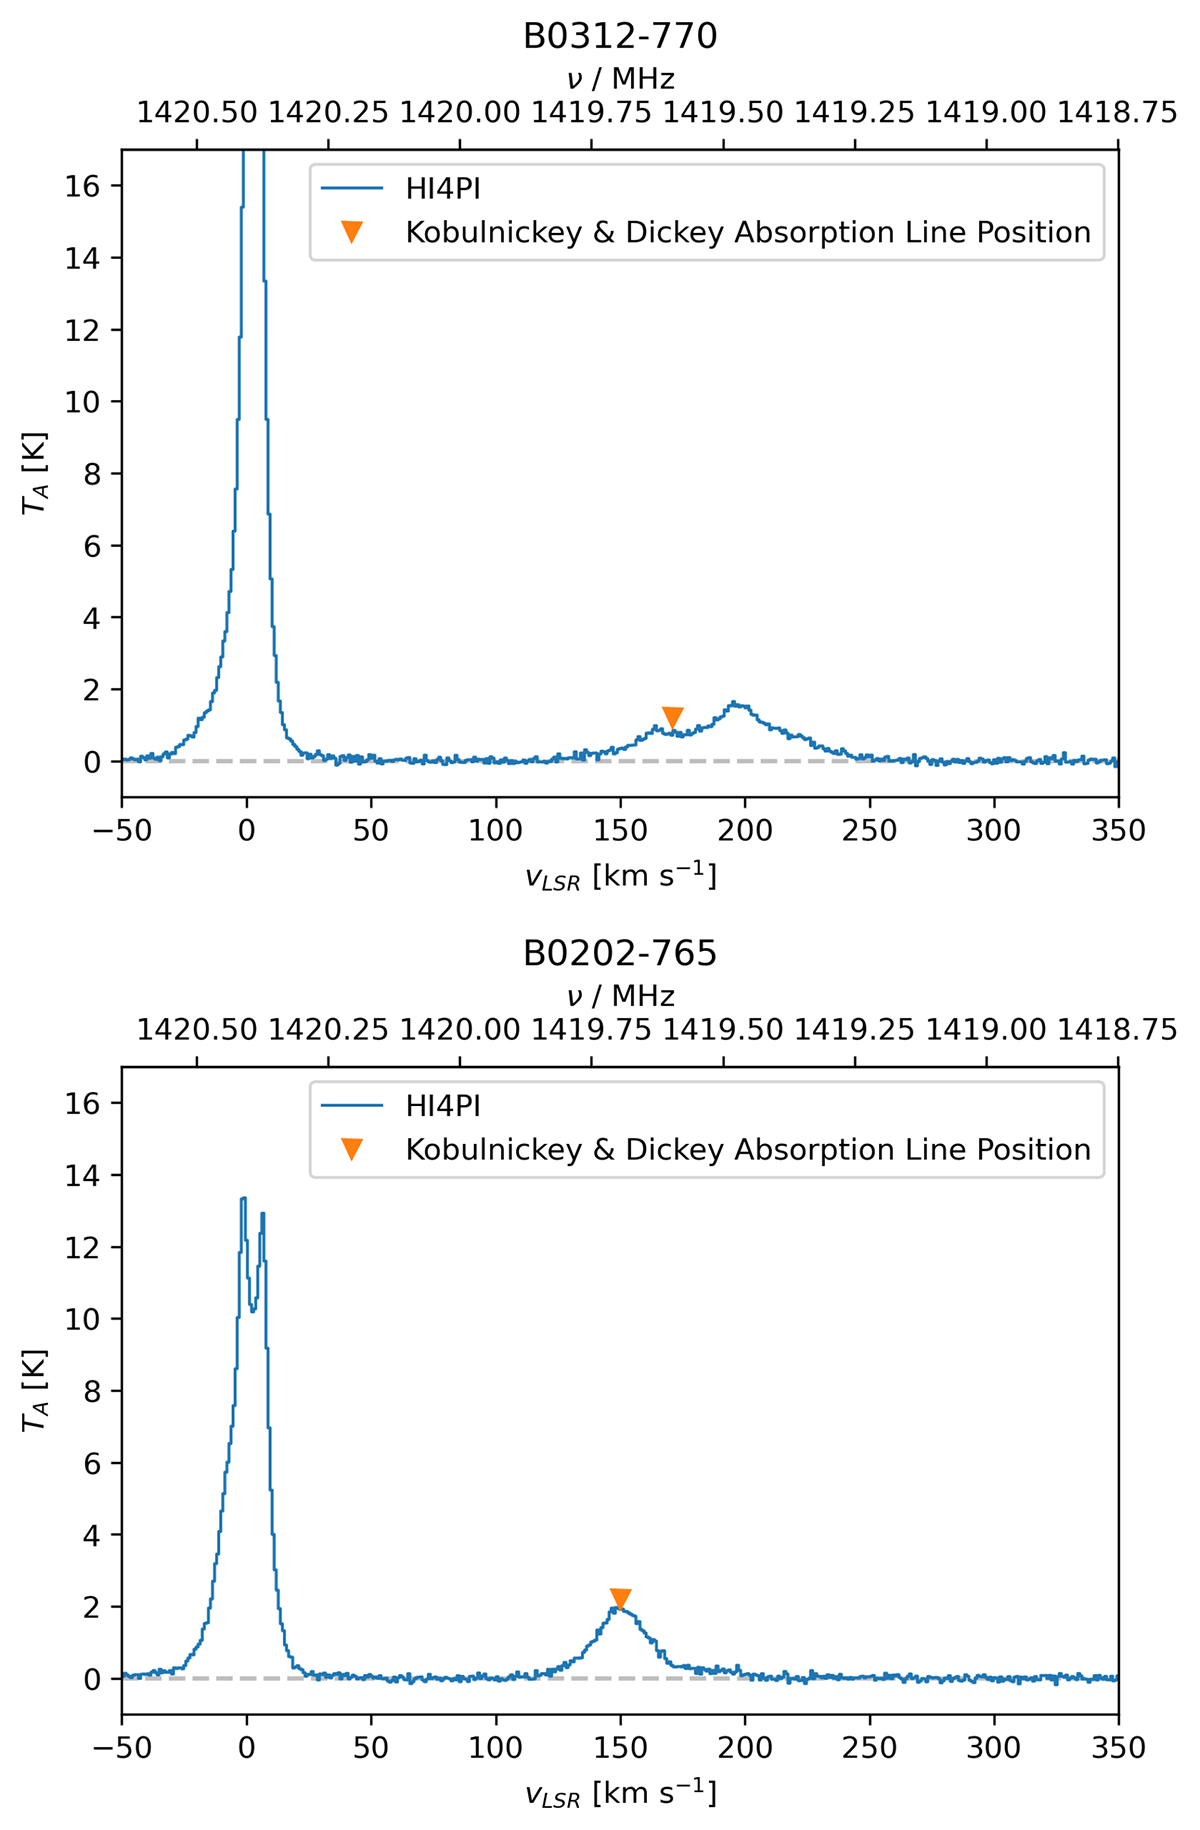
HI4PI emission spectra from the AIfA H I Surveys Data Server (2024) toward B0312-770 and B0202-765 at which Kobulnicky & Dickey (1999) detected absorption lines. The velocity component of the absorption line with the highest column density is marked with an orange triangle.
Current usage metrics show cumulative count of Article Views (full-text article views including HTML views, PDF and ePub downloads, according to the available data) and Abstracts Views on Vision4Press platform.
Data correspond to usage on the plateform after 2015. The current usage metrics is available 48-96 hours after online publication and is updated daily on week days.
Initial download of the metrics may take a while.