Fig. 9.
Download original image
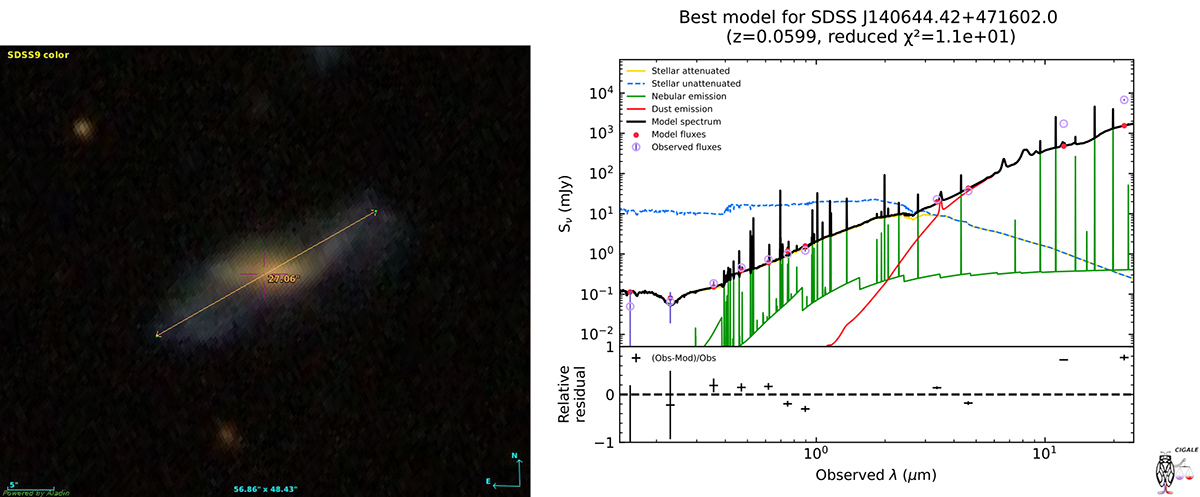
PRG SDSS J140644.42+471602.0 discovered with transfer learning. (a) The image is obtained by the Aladin tool where the yellow line is the estimated line of sight size in the optical band. (b) Best approximation of the SED from UV to IR bands. Red dots are model fluxes; purple dots are observed fluxes. The green curve describes the nebular emission, the yellow curve – the stellar component without attenuation, the blue dashed curve describes the stellar component with attenuation, the red curve – dust radiation. The black curve is the resulting model SED.
Current usage metrics show cumulative count of Article Views (full-text article views including HTML views, PDF and ePub downloads, according to the available data) and Abstracts Views on Vision4Press platform.
Data correspond to usage on the plateform after 2015. The current usage metrics is available 48-96 hours after online publication and is updated daily on week days.
Initial download of the metrics may take a while.