| Issue |
A&A
Volume 702, October 2025
|
|
|---|---|---|
| Article Number | A258 | |
| Number of page(s) | 13 | |
| Section | Extragalactic astronomy | |
| DOI | https://doi.org/10.1051/0004-6361/202555052 | |
| Published online | 28 October 2025 | |
Discovery of the polar ring galaxies with deep learning
1
Main Astronomical Observatory of the NAS of Ukraine, street27, Akademik Zabolotnyi St. Kyiv, 03143, Ukraine
2
Taras Shevchenko National University of Kyiv, Hlushkov Ave., 4, Kyiv, 03127, Ukraine
3
Northwestern University, 633, Clark St., Evanston, IL 60208
Chicago, USA
⋆ Corresponding author: This email address is being protected from spambots. You need JavaScript enabled to view it.
Received:
5
April
2025
Accepted:
5
August
2025
Abstract
Context. Polar ring galaxies (PRGs) play an important role in understanding the evolution of galaxies, especially as unique cases of gas accretion and merging process between early and late morphological galaxy types. Regardless of their spectacular shape, these objects are very few in number and hard to find. Most of them were visually discovered, and then several of them were photometrically validated and kinematically confirmed.
Aims. The aim of our research is to create a catalogue of strong and good candidates for PRGs using existing catalogues of PRGs; develop an image-based approach with machine learning methods for the search and discovery of PRGs in a big sky survey; explore the capability of the CIGALE software for determining their multiwavelength properties.
Methods. For the first time, we applied a deep learning method to the search for PRGs. We visually inspected galaxies from existing catalogues of PRGs to create a training sample based on high-quality SDSS images. Since the resulting training sample was extremely small (87 strong and good PRGs), we applied augmentation, image segmentation, and ensemble learning techniques. However, the most effective method was transfer learning, with its ability to enlarge the training sample by synthetic images generated by GALFIT. To examine the deep learning approach for finding new PRGs, we used the SDSS catalogue of galaxies at z < 0.1. The method with synthetic images showed that even with overtraining, we can find galaxies with a ring pattern.
Results. Our deep learning approach has resulted in the discovery of three PRGs (SDSS J140644.42+471602.0; SDSS J133650.48+492745.3; SDSS J095717.30+364953.5). We also visually inspected the catalogue of the SDSS ring galaxies at z < 0.1 and discovered four PRGs among ∼2200 ring galaxies (SDSS J095851.32+320422.9; SDSS J104211.05+234448.2; SDSS J162212.63+272032.2; SDSS J104600.10+090627.2). One of the discovered galaxies with transfer learning, SDSS J140644.42+471602.0, was studied with CIGALE software to determine its spectral energy distribution from IR to UV bands. The current SFR is 71 M⊙ per year, although the lack of FUV data limits this estimate. The total stellar mass is 8.34 × 10¹⁰ M⊙. The predominance of an old stellar population (two-thirds of the total mass) suggests that this PRG is undergoing an interaction process. We also explored the nuclear activity and isolation neighbourhood of several PRGs. Finally, we present a catalogue of 179 visually inspected PRGs. Supplemented with new discovered objects, this catalogue will become quite useful for the convolutional neural network approach and theoretical studies. Our strategies represent valuable opportunities for future development of deep learning models to achieve more quantitative PRG identification in sky surveys.
Key words: methods: data analysis / techniques: image processing / catalogs / galaxies: general / galaxies: peculiar
© The Authors 2025
 Open Access article, published by EDP Sciences, under the terms of the Creative Commons Attribution License (https://creativecommons.org/licenses/by/4.0), which permits unrestricted use, distribution, and reproduction in any medium, provided the original work is properly cited.
This article is published in open access under the Subscribe to Open model. This email address is being protected from spambots. You need JavaScript enabled to view it. to support open access publication.
1. Introduction
Since the discovery of the first galaxies with polar rings, NGC 4650A (Sérsic 1967); NGC 2685 (Schechter & Gunn 1978); NGC 1947, NGC 5128 (Cen A), NGC 5363, and Cyg A (Bertola & Galletta 1978; Bertola et al. 1985); A 0136-0801 (Schweizer et al. 1983); ESO 415-G26 (Whitmore et al. 1987), and NGC 5266 (Varnas et al. 1987), and the first Atlas of images of such galaxies (Whitmore et al. 1990), their unique shape, morphology, formation mechanisms, large-scale distribution, and evolution parameters remain in the focus of attention of both observers and theorists. Polar ring galaxies (PRGs) are rare types of galaxies in which an outer large-scale ring or disc of stars, gas, and dust orbits above the central galaxy’s poles. Polar rings are thought to form only when the gas density in the plane of the galaxy is low (otherwise, the ring is slowed down by collisions of the ring gas with the gas in the plane of the central galaxy, so the polar ring is not typical for spiral galaxies, which are rich in gas). Polar rings are more or less perpendicular to the plane of the galaxy, rarely deviating more than 25 degrees from the perpendicular; otherwise, the ring quickly collapses due to interaction with the disc of the central galaxy.
Notably, PRGs allow to improve the dynamical theory of galaxy formation through merging, elaborate theories and numerical simulations of the gas accretion process during the interaction of galaxies of different morphological types, to understand their evolutionary role, and to estimate the amount of dark matter in galaxies by measuring the rotation rate of the highly extended ring, which typically rotates too fast to be held together by only the visible stars. There are a few dominant theories of the formation of PRGs.
The first leading theory suggests that two galaxies form this peculiar system due to a major merger process in the distant past, when material from another galaxy was gravitationally captured by a central galaxy and strung out in a rotating ring. In other words, the smaller galaxy orthogonally passing through the plane of rotation of the larger central galaxy survived and became a ring structure accreting around the larger galaxy (Schweizer et al. 1983; Bekki 1997, 1998). Recently, Akhil et al. (2024a) explored the globular cluster system of NGC 4262 and found evidence of previous interactions within the central galaxy, which supports the assumption that this PRG is in an intermediate phase of merging with smaller quiescent galaxies.
The second theory states that the polar ring formed by gas accretion from the donor galaxy that orbits the dominant galaxy in a nearly orthogonal orbit. The gas accretion comes from tidal interaction, and no major merger process occurred.
Bournaud & Combes (2003) studied these two theories using N-body simulations, including gas dynamics and star formation processes. They concluded that the accretion scenario is the most likely. Ordenes-Briceño et al. (2016) explored the tidal interaction between NGC 3808 A and B in favour of the tidal process. Both theories need to explain the problem of the central disc retaining its rotational support in systems such as NGC 4650A, where polar discs are significantly massive. We note that Haud (1988) supposed and Ibata et al. (2003) found that our Milky Way galaxy also probably had a faint polar ring related to the Large Magellanic Cloud. Modern studies do not confirm this hypothesis (see, for example, Xu et al. 2023), and Gaia discovered that the last major merger of the Milky Way with the Gaia Sausage Enceladus was 8–11 billion years ago (Helmi et al. 2018; Naidu et al. 2021; Vavilova et al. 2024) which indicates that no massive accretion or tidal events capable of forming a stable polar ring took place in the more recent history of the Milky Way.
The third theory is also based on a cold gas accretion mechanism, but from intergalactic space along cosmological filaments, which may form and continue to feed polar discs. Macciò et al. (2006) showed that the formation of such a system can occur naturally in a hierarchical scenario, where most low-mass galaxies are assembled through the accretion of cold gas in-falling along megaparsec-scale filamentary structures. Brook et al. (2008) used high-resolution cosmological simulations of such a PRG formation. According to their model, PRGs form through continuous gas accretion, whose angular momentum is misaligned with the central galaxy. In other words, a polar ring can be formed in a thinning wall between two voids as a result of the cold gas accretion from the voids. Such a system, VGC12, was found by Stanonik et al. (2009), where a single HI disc is perpendicular to the stellar disc of the void galaxy SDSS J102819.24+623502.6 and demonstrates slow accretion. This galaxy is oriented roughly parallel to the surrounding wall, implying gas accretion from the two voids on whose boundary it is located. There were no neighbouring galaxies within a 3.5 Mpc radius from the studied galaxy. Stanonik et al. (2009) concluded that a major merger or tidal encounter scenario of PRG formation is unlikely in this case and proposed the mechanism of cold gas accretion from the voids (see also, Kreckel et al. 2016; Beygu et al. 2017; Grossi 2019).
The similar systems of HI polar ring were recently discovered around NGC 4621 and NGC 6156 in the frame of the WALLABY pilot survey Deg et al. (2023), supporting the theory that HI gas can move along the lines of the cosmic web through intergalactic space and end up in orbit around nearby galaxies forming PRG. Snaith et al. (2012) studied the inner regions of the PRG dark matter halo, which are often flattened perpendicular to the old stellar disc, aligning with the polar disc out until the virial radius. They also claimed that the polar disc structure is the result of the direct gas accretion from the filament, with continuous evolution of the angular momentum of the in falling gas and stars.
N-body simulations by Bournaud & Combes (2003) favour most PRGs to be the result of a tidal gas accretion scenario as compared to the major merging scenario, which is also rather robust. A study of PRGs from TNG50 cosmological simulations provided by Smirnov et al. (2024) tracking two-path formation, showed that rings formed during the star formation in the accreted gas are, on average, bluer and younger than ones formed due to the smaller galaxy disruption. Understanding whether the PRGs are from major mergers or gas accretion (tidal mechanisms with flyby galaxies or through filamentary structures) will provide constraints on galaxy formation and evolution.
In general, these results meet the isolation criteria to test the location of PRGs and their neighbourhood (Vavilova et al. 2009; Beygu et al. 2011; Melnyk et al. 2012; Freitas-Lemes et al. 2014; Pulatova et al. 2015; Dobrycheva et al. 2018; Mahdi Ali 2021) as well as to take into account the ‘morphology – environmental density’ relation. The morphology of PRGs has peculiarities: The central galaxy, in the overwhelming majority of cases, is an early-type galaxy, and the ring around it is a late-type galaxy. The most central galaxies of known PRGs are lenticular galaxies (S0). However, there are other types of galaxies among them, including several ellipticals (E1), such as NGC 1947, NGC 5128, NGC 5363, Cyg A, NGC 5266, and IC 2006 (Bertsik & Kolesnik 1992), and even spirals, for example, NGC 2748 and NGC 660 (Bettoni & Galletta 2001; Argo et al. 2015), where the gas rotation is present both along the polar ring and the ring at the equatorial plane of the stellar disc.
The theories mentioned above and the research that has been conducted suggest possible mechanisms for the formation of PRGs. The diversity of results only confirms that the individual characteristics and group trends of these spectacular and rare objects are not yet fully understood. The existing PRG catalogues and lists are compiled primarily by visual inspection and validation (Whitmore et al. 1990; Moiseev et al. 2011; Reshetnikov & Mosenkov 2019). The photometrical studies are often difficult because these galaxies have a complex structure of two morphological types. The polar ring may be dimmed or destroyed by tidal effects. In the case of a nearby PRG, the telescope aperture size covers part of the galaxy or the overlapped central part. However, Lackey et al. (2023, 2024) have demonstrated that in several cases of PRGs, a multiwavelength analysis of polar rings can be exploited to estimate the sizes, ages, masses, and star formation rates (SFRs) using photometry and spectral energy distributions (SEDs) in the optical and UV bands.
There are numerous works on applying different machine learning methods to determine the morphology of galaxies, including our experience (Vavilova et al. 2021a,b; Khramtsov et al. 2022; Vavilova et al. 2022; Fang et al. 2023), as well as studies on searching for rare morphological types such as galaxies with rings (Krishnakumar & Kalmbach 2024; Zhang et al. 2025). A more detailed review on the applications of machine learning to galaxy surveys is published by Huertas-Company & Lanusse (2023). We apply deep learning to search for PRGs for the first time.
The aim of our paper is to develop an image-based approach with machine learning methods for the search and discovery of PRGs in a big sky survey; to create a catalogue of strong and good candidates for PRGs, with clearly visible polar rings, using existing catalogues of PRGs; to explore the capability of the CIGALE software for determining the multiwavelength PRGs’ properties. We describe a new catalogue of PRGs compiled after visual inspection in Section 2; the CNN approach for PRG identification is given in Section 3; the procedure with transfer learning through simulated images and results for the discovered PRG candidates is presented in Section 4; visually discovered PRGs candidates are briefly noted in Section 5; the multiwavelength analysis of one of the strongest PRG candidates found by us, SDSS J140644.42+471602.0, is exploited as an example with CIGALE software in Section 6; other results, including the estimates of density environment of discovered PRGs, their activity type, and conclusions are summarised in Section 7; data availability is described in Data availability section.
2. Catalogue of visually inspected PRGs
2.1. Available observational data for the formation of the PRG sample
Our preliminary sample of 463 candidates of PRGs was compiled from existing catalogues of PRGs and covered four sources: the Atlas of Polar Ring Galaxies by Whitmore et al. (1990); SDSS-based Polar Ring Catalogue by Moiseev et al. (2011); a list of new candidates to polar ring galaxies by Reshetnikov & Mosenkov (2019); and results by Skryabina et al. (2024).
The Atlas of Polar Ring Galaxies by Whitmore et al. (1990) was compiled by visually inspecting galaxies from the Uppsala General Catalogue of Galaxies (Nilson 1973), the ESO Catalogue of Galaxies (Lauberts 1982), and the Southern Atlas of Peculiar Galaxies (Arp & Madore 1987), which were commented on as having an unusual needle-like or similar shape. In total, this Atlas included 157 objects divided into four categories: kinematically confirmed PRGs (six galaxies), good candidates (27 galaxies), possible candidates (73 galaxies), and possibly related systems (51 galaxies). Among the kinematically confirmed PRGs are A0136-0801, ESO 415-G26, NGC 2685, UGC 7576, NGC 4650A, and UGC 9796.
A new catalogue of PRGs by Moiseev et al. (2011) includes 275 objects. They have visually examined around 42 000 Galaxy Zoo Lintott et al. (2011) images classified by citizen scientists and searched the Galaxy Zoo Internet forum dedicated to ring galaxies. These authors selected galaxies belonging to EDGE (edge-on spiral galaxies), MG (systems undergoing interactions), and DK (don’t know, or unidentified) classes with probabilities of ≥0.1, ≥0.05, and ≥0.05, respectively. Moiseev et al. (2011) identified the following categories: best candidates (70 galaxies), good candidates (115 galaxies), related objects (53 galaxies), and possible face-on rings (37 galaxies).
Reshetnikov & Mosenkov (2019) prepared a list of 31 new candidates for PRGs by visual inspection and analysing the Galaxy Zoo Project discussion boards.
With the launch of new sky surveys, the units of PRGs were found. Skryabina et al. (2024) examined deep optical images of 838 edge-on galaxies from SDSS Stripe 82, DESI Legacy Imaging Surveys, and Hyper Suprime-Cam Subaru Strategic Program images. We added to our catalogue of PRGs only three galaxies, which these authors labelled as the objects with dim polar rings (SDSS RA: 333.748, Dec: 1.020; SDSS RA: 326.580, Dec: –0.208; SDSS RA: 29.743, Dec: –0.490). We also added to our catalogue the PRG DES J024008.08–551047.5 (DJ0240) with the Dark Energy Camera Legacy Survey discovered by Akhil et al. (2024b).
Bahr & Mosenkov (2024) also announced the selection of 102 galaxies with polar structures (polar rings, polar halos, polar bulges, and forming polar structures), reviewing over 18 000 galaxies in the same sky surveys. These lists are not yet published, so we did not include them in consideration.
2.2. Visual inspection of PRG sample
We needed to make sure that the images we were going to use for training are suitable for this task. The authors of the mentioned catalogues of PRGs adopted their own classification categories as ‘best’, ‘good’, ‘possible’, ‘related’, and so on. For this reason, we decided to conduct our own visual inspection and classification to be sure in finding each PRG candidate for inclusion in the training sample.
We visually inspected 463 objects from our PRG sample across the SDSS DR18 Navigate Tool, optical images taken from the 2.5-m Apache Point telescope in pursuit of multiple goals: to determine ‘Strong’ and ‘Good’ quality PRG images that would be most suitable for training the CNN; to identify new PRGs within ‘The image-based morphological catalogues of SDSS galaxies at 0.02 < z < 0.1’ by Vavilova et al. (2021a).
Consequently, a visual inspection was performed for 355 objects, which matched good quality SDSS images (Vavilova et al. 2020). The remaining 108 objects located in the southern sky were not considered because we have no SDSS images for them. The division of PRG candidates into ‘Strong’, ‘Good’, and ‘Weak’ categories reflects the varying degree of visual evidence for the presence of a polar ring; i.e., confidence in the galaxy in fact being a PRG. In the visual inspection process, we split this sample into the following categories:
-
Strong candidates are galaxies with polar rings, which are clearly visible and 26 of them were found. However, we know from the original catalogues that most are not yet kinematically confirmed as PRGs. Examples of strong PRGs are shown in Figure 1(a).
-
Good candidates: from the remaining 329 PRG candidates, 141 galaxies with dim polar ring features were visually stand out. Of course, 26 ‘Strong’ objects are not enough to train the neural network. For this reason, we selected 61 galaxies from dim PRGs, which are suitable for the training sample (the contrast and resolution of their images are lower than the ‘Strong’ candidates). Examples of good PRGs are shown in Figure 1(b).
-
Weak candidates are galaxies, in which the polar rings are hardly differentiated but are still visible, 79 of them were found.
-
Ring galaxies are galaxies with rings that are not oriented in the polar plane, 32 of them were found in our catalogue of PRGs. Examples one of them is shown in Figure 2(a).
-
Merging galaxies are galaxies experiencing collisions with each other, 20 of them were found.
-
Dust lane galaxies are galaxies exhibiting a dust lane, which could be confused with having a polar ring, 31 of them were found in our catalogue of PRGs. Examples one of them is shown in Figure 2(b).
-
Line-of-sight galaxies are objects where the closer galaxy visually covers the farther one, making them appear similar to PRGs, 11 of them were found in our catalogue of PRGs. Examples one of them is shown in Figure 2(c).
-
We found 39 irregular galaxies with no polar ring in our sample (Figure 2(d)). Galaxies, which we classified as ‘Irregular’, come from the Whitmore et al. (1990) catalogue, and most of them belong to ‘possible candidates’ and ‘related objects’ in their classification, respectively. These galaxies were included by Whitmore et al. (1990), when the resolution of available images was worse than what is available now, and so such misclassifications are understandable.
-
We found one quasar PG 1100+772 (3C 249.1) in the Atlas by Whitmore et al. (1990). It was included by these authors because at that time Stockton & MacKenty (1983) supposed that this object had a ring structure. However, when viewed in SDSS, no ring structure is visible.
-
We also found 54 non-ring galaxies that do not exhibit any ring structure through visual inspection on SDSS images.
-
Object SPRC 198 (Moiseev et al. 2011) turned out to be a duplicate of object SPRC 102 and therefore was excluded from our sample.
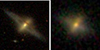 |
Fig. 1. Examples of PRG candidates identified by visual inspection: (a) Strong, RA: 24.7301, Dec: –7.7654, z = 0.035, kinematically confirmed by Whitmore et al. (1990); (b) Good, RA: 10.2643, Dec: –9.9411, z = 0.037 (Moiseev et al. 2011). |
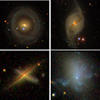 |
Fig. 2. Non-PRGs identified by visual inspection: (a) Ring, RA: 240.3706, Dec: 19.3598, z = 0.015 (Whitmore et al. 1990; b) Dust lane, RA: 173.1451, Dec: 53.0679, z = 0.0033 (Whitmore et al. 1990) more detail in Akhil et al. (2025); (c) Line of sight, RA: 349.5518, Dec: 4.1851, z = 0.040 (Whitmore et al. 1990); (d) Irregular, RA: 125.9668, Dec: 14.7521, z = 0.007 (Whitmore et al. 1990). |
2.3. Training sample for machine learning image-based approach
Our training sample consisted of 87 PRGs, which were classified as ‘Strong’ and ‘Good’ objects with high-quality SDSS images. Of course, it is an extremely small sample for training a machine learning model. Such a limited sample size could lead to overfitting of machine learning methods and poor generalised. Therefore, we must apply methods that expand the training sample while keeping the key features of the images. In the following sections, we present and discuss different approaches designed to increase the number of training examples and improve the model performance.
3. CNN image-based approach for PRG identification
3.1. Data generation using augmentations
To solve the problem with the imbalance of the training sample, we utilised TorchVision1 transforms to generate augmented data using a composed set of random horizontal and vertical flips with random rotations. This approach was empirically selected after testing different augmentation combinations such as Colour Jitters, Random Perspectives, and other methods. We performed these augmentations to increase the dataset size and improve the model’s generalisation ability from the limited data available.
Images of PRGs were obtained using the SDSS cutout service via the following SkyServerWS ImgCutout2, where we manually chose IMG_SIZE to make sure the galaxy fits inside the image. So, the sizes vary from dozens to hundreds of pixels, due to the different apparent sizes.
To address class imbalance, we generated 8 augmented images for each PRG image, thereby balancing the PRG class with the ‘others’ class. The dataset was then split into training, validation, and test sets in an 80/10/10 ratio, respectively. For further implementation details, please refer to the GitHub3 prg_classification_showcase notebook.
Both original and generated images were resized to 80x80 pixels using bicubic interpolation (Keys 1981). We have chosen this resolution as the minimal shape of the input data while ensuring feature preservation. Bicubic interpolation was preferred for downscaling because it maintains the original information better than bilinear or nearest neighbour, which can introduce artefacts and degrade image quality.
3.2. Image segmentation
The positions of each of the 87 PRGs are located in the central regions of the images. The other information around them is not necessary for the mentioned task. So, to focus only on the relevant features and erase the unnecessary data, we defined a custom transformation to segment the central object using the Astropy (Astropy Collaboration 2018) and Photutils (Bradley et al. 2024) Python packages.
The main routine for this transformation involved several steps. Firstly, we subtracted the median background to increase the contrast between the galaxy and the surroundings. Then we convolved the image with a Gaussian kernel to smooth it and reduce the noise. Following this, we applied source detection to identify objects within the image that exceeded a defined threshold. This threshold-based detection helped to pinpoint the central object accurately.
After detecting the sources, we normalised the images to ensure uniformity across the dataset. Finally, we extracted the central object, placing it against a black background. So, for the input for our model, we have used this processed image, now containing only the central galaxy (as illustrated in Figure 3).
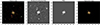 |
Fig. 3. Illustration of the segmentation process applied to a sample image from the training dataset. The leftmost image displays the original data point. The subsequent image demonstrates the background-subtracted data. This is followed by the mask delineating the defined central source. The rightmost image represents the segmented output, which we used as input for the neural network. The procedure was executed within a single colour channel. |
3.3. Architecture and training
The architecture of our main model consists of two successive convolutional blocks with ReLU activation functions, dropout layers, and one pooling layer. Following the convolutional block, the classifier section consists of a flattening layer, a dense layer, and a sigmoid activation function.
The training process utilises a Binary Cross Entropy Loss function and the AdamW optimiser (Loshchilov & Hutter 2019), complemented by a learning rate scheduler that automatically reduces the learning rate upon encountering a plateau. Through an extensive grid search, we optimised the hyperparameters to include one double convolutional block, 10 hidden units, an initial learning rate of 10−4, weight decay for L2 regularisation of 10−3, and a dropout rate of 0.5. So, the network converges within 100 epochs, achieving an accuracy of up to 90%.
The model’s performance is illustrated in Table 1, which presents a confusion matrix derived from the additionally generated images in the test set. The model achieves an accuracy of ≈88%. Despite demonstrating excellent performance on the training, validation, and test sets, the model struggles to generalise across a representative SDSS sample. The sample we used is a catalogue of 315 000 galaxies from SDSS by Vavilova et al. (2021a). The model classified 48,974 galaxies as PRGs out of the entire sample, which is ∼16% of the galaxies in this catalogue. Given the rarity of PRGs – 0.5 − 3% of all galaxies (Whitmore et al. 1990; Mosenkov et al. 2024), the obtained implausibly high number of PRGs is a result of CNN model overfitting.
Resulting confusion matrix for the test dataset.
3.4. Model ensemble and potential improvements
To further explore the capabilities of our approach, we conducted two additional independent training sessions using slightly different architectures. The first was a simpler model without convolutional layers, while the second retained the same architecture as the main model but included the segmentation step. By combining the predictions from these models into an ensemble with equal weighting, we aimed to improve classification performance. As a result of this ensemble approach, 17 galaxies were classified as PRGs with scores higher than 0.9. However, upon visual inspection, none of these galaxies exhibited the characteristics of PRGs. Half of the misclassified galaxies were edge-on galaxies, and the other half were images with many artefacts. The programming code is available on GitHub4.
Another independent approach was to train a shallow neural network with one hidden layer. To address the problem of an insufficient dataset, the number of PRG images was increased by 25 times through data augmentation. The model made many false-positive predictions when applied to Vavilova et al. (2021a) dataset. Through visual inspection, 25 potential candidates with an accuracy of 0.94 to be PRGs or related objects were selected. Most of these galaxies do not fit the PRG classification, since they are spirals with untwisted arms.
We considered one more galaxy as a PRG candidate (SDSS, RA: 204.2103, Dec: 49.4625, z = 0.097) found by the shallow neural network model. Despite its SDSS image overlapping with an artefact, a deep learning approach allowed us to discover this PRG (see Figure 4, first row, where SDSS (left) and DESI Legacy Survey (right) images are given).
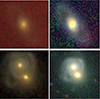 |
Fig. 4. Discovered PRGs by machine learning (shallow neural network) with accuracy 0.94. First row: (left) SDSS image and (right) DESI Legacy Survey image of PRG with RA: 204.2103, Dec: 49.4625, z = 0.097. Second row: (left) SDSS image and (right) DESI Legacy Survey image of double PRG system with RA: 149.3220, Dec: 36.8315, z = 0.053 (centre) and RA: 149.3231, Dec: 36.8332, z = 0.054 (top). |
We also focus on two images of galaxies, which our deep learning approach recognised as the PRGs. One is the PRG from the catalogue by Moiseev et al. (2011) assigned by them as a good candidate. Another is a pair of galaxies (second row in Figure 4). This pair has a ring pattern; one galaxy is elliptical (SDSS RA: 149.3220, Dec: 36.8315, z = 0.053), and the second galaxy is a late-type galaxy (SDSS RA: 149.3231, Dec: 36.8332, z = 0.054). Since they are at a reasonably close distance, we suggest that the beginning of the interaction is fixed, and we found an example of a PRG candidate supporting the merging mechanism (see Akhil et al. 2024a). That is why this pair of objects should be investigated in more detail.
The programming code of the CNN model, which allowed the discovery of two PRGs, is available on GitHub5.
4. Transfer learning via simulated images
The biggest challenge in classifying PRGs is training a neural network on a severely insufficient dataset. To combat this issue, we decided to use transfer learning. Given that a pre-trained model exists, it allows us to train a neural network on a smaller dataset. We apply this method to a CNN, which we pre-trained on a synthetic dataset of images, generated via GALFIT, which is supposed to improve the performance of the model.
4.1. Simulated galaxies with GALFIT
GALFIT (Peng et al. 2002) is mainly used to fit light profiles to galaxies. However, it can also generate such light profiles by manually setting parameters via input files, allowing us to create a dataset of simulated PRG images.
Ghosh et al. (2020) developed the GalSim code, which generates input files and then runs GALFIT to automatically generate the required number of images with randomised parameters. Later, Krishnakumar & Kalmbach (2024) used the modified GalSim code to generate a sample of simulated galaxies with rings. The process of simulating images of galaxies with GalSim goes as follows. First, a chosen number of GALFIT input files is created with simulation parameters. Then, GALFIT is run on these files, producing the simulated images. To make simulated images resemble images from the survey in question, a random noise is added, and the image is convolved with a corresponding PSF. Finally, FITS image files are converted to JPG.
To simulate the central galaxy, we used the Sérsic function, which is widely used in galaxy morphology. The Sérsic profile is defined as (Peng et al. 2002):
![Mathematical equation: $$ \Sigma (r) = \Sigma _e \exp \left[ -\kappa \Biggl ( \left( \frac{r}{r_e}\right)^{1/n} - 1\Biggr ) \right], $$](/articles/aa/full_html/2025/10/aa55052-25/aa55052-25-eq1.gif)
where Σe is the pixel surface brightness at the radius re, representing the radius at which half of the galaxy’s flux is contained. n is the Sérsic index of the galaxy, which controls where the light of the galaxy is concentrated, and κ depends on this parameter to ensure that half of the flux stays within radius re from the centre. For accurate simulation, the polar-ring component must be truncated in the centre. This is achieved by multiplying the Sérsic function of the polar ring component by a hyperbolic tangent truncation function in GALFIT.
We have taken the parameters from Krishnakumar & Kalmbach (2024) for generating non-ring and ring galaxies. We modified them to simulate PRGs by rotating the position angle of the ring component by 90° and the axis ratio of the ring component in such a way that the image resembles a PRG more closely (parameters are shown in Table 2). In total, 1000 PRG images and 3000 non-PRG images were simulated using GALFIT, which is enough to train a neural network. The model was trained on the synthetic dataset over eight epochs utilizing the Adam optimiser (Kingma & Ba 2015) with the learning rate of 10−4, reaching convergence on training and validation sets.
GALFIT parameters for the inner component and polar ring component of the PRG.
4.2. Transfer learning and final search
Transfer learning includes the ‘freezing’ of most model layers, except for the output layers, which undergo retraining on the new data. For this training dataset, we used 87 available PRG images and randomly selected 900 images of non-PRGs from the catalogue by Vavilova et al. (2021a). Morphologies of galaxies in the non-PRG sample are described by Vavilova et al. (2021a); Khramtsov et al. (2022). The pre-trained model with a new trainable output layer was trained over 35 epochs using the Adam optimiser with 10−4 learning rate. The model reached convergence, although there appears to be a discrepancy between training and validation loss. The model reached an unexpectedly high accuracy of 95.3% on the test set, which could indicate overfitting.
Despite overfitting, we decided to apply the final model to the catalogue of 315 000 SDSS galaxies by Vavilova et al. (2021a). Figure 5 shows the distribution of probabilities for galaxies to have a polar ring. One can see that a larger number of galaxies were classified as PRG rather than non-PRG due to the very biased nature of the histogram towards the CNN score = 1 Figure 5. The CNN assigned a score of greater than 0.999 to 3246 galaxies.
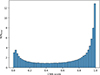 |
Fig. 5. Distribution of CNN score for SDSS galaxies from catalogue by Vavilova et al. (2021a) to be PRG candidates. |
We have visually inspected these 3246 galaxies that received a score greater than 0.999. Our experience with a machine learning photometry- and image- based approach for the classification of morphological features of galaxies from this SDSS catalogue shows (Vavilova et al. 2021a, 2022; Khramtsov et al. 2022) that despite the probability of a galaxy having a specific feature being assigned by the CNN, visual inspection proves that the galaxy indeed has this feature, even if the CNN score is low.
Our visual inspection pointed out that many objects with the highest scores appeared similar to objects that could be related to or reasonably confused with PRGs. The model selected many late spiral galaxies with loosely wound spiral arms, which may have been mistaken for rings. Additionally, CNN identified regular ring galaxies and merging galaxies that could be misinterpreted as having a ring-like structure. We describe below some interesting misclassified cases.
The images of late spirals are more precisely irregular-like, with the highest CNN score. We found two galaxies with coordinates RA: 173.8703, Dec: 38.5550, z = 0.022, and RA: 151.3460, Dec: 19.2718, z = 0.013 (‘a’ and ‘b’ in Figure 6, respectively). These images are similar to those of galaxies, which were classified as good candidates in the catalogue by Reshetnikov & Combes (2015) (see ‘d’ in Figure 6). Our CNN caught a few galaxies with coordinates RA: 222.8091, Dec: 35.5406, z = 0.004 (see, ‘d’ in Figure 6), and RA: 161.5985, Dec: 6.6194, z = 0.028, which are listed in the catalogues by Reshetnikov & Combes (2015), Moiseev et al. (2011). This means that the proposed CNN code was able to identify them.
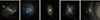 |
Fig. 6. Examples of polar ring galaxy candidates identified by the CNN: (a) SDSS, RA: 173.8703, Dec: 38.5550, z = 0.022; (b) SDSS, RA: 151.3460, Dec: 19.2718, z = 0.013; (c) SDSS, RA: 165.7470, Dec: 34.9276, z = 0.032; (d) SDSS, RA: 222.8091, Dec: 35.5406, z = 0.004 (Reshetnikov & Combes 2015; e) SDSS, RA: 195.6699, Dec: 50.4401, z = 0.024. |
Interesting example, when three galaxies were assigned as PRGs: (1) SDSS, RA: 195.6699, Dec: 50.4401, z = 0.024; (2) SDSS, RA: 178.2528, Dec: 44.1393, z = 0.070; (3) SDSS, RA: 3.9988, Dec: –0.3049, z = 0.040. However, visual inspection and image zooming showed that they are elliptical galaxies located near a galaxy’s spiral arm. Their overlap creates the appearance of rings around the elliptical (‘e’ in Figure 6).
The CNN misclassification has at least three reasons: the limited training set as a whole; the limited number of qualitative examples of images available to the model (resolution and contrast) in the training set; even existing examples lack diversity of variations for the location of the polar ring.
Our most significant finding in this study with transfer learning is the discovery of the SDSS J140644.42+471602.0 (see ‘a’ in Figure 9), which is a polar ring galaxy (SDSS, RA: 211.6850, Dec: 47.2672, z = 0.060). The programming code of the CNN model with transfer learning, which allowed us to discover this PRG and reveal typical errors of CNN misclassification, is available on GitHub6.
The small number of examples for training led to the fact that the CNN ‘remembered’ the patterns of PRGs and could not work with a more complex sample with a large variety of morphological shapes of galaxies. In addition, the unevenness of the classes in the sample caused bias in the classification: the model often assigns either high or very high scores, ignoring the mean values. The examples of what was ranked highly by the trained algorithm can be seen in Figure 6. We also visually inspected the first 100 galaxies that were ranked low by the trained algorithm of having a polar ring, and as a result of our inspection, we saw that most of these objects had artefacts on the image.
5. Visually discovered PRGs from the catalogue of SDSS ring galaxies
The catalogue of the SDSS ring galaxies at z < 0.1 is a part of a catalogue developed with photometry- and image-based machine learning techniques (Vavilova et al. 2023). We have done a visual inspection of 13 882 objects, which allowed us to identify and remove misclassified machine learning objects and enhance the accuracy of the morphological classification of the ring feature. The catalogue of the SDSS ring galaxies, containing ∼2 200 objects, is available on the UkrVO website7.
During the visual inspection of ∼2200 ring galaxies, we discovered four PRG candidates: (a) SDSS, RA: 149.7138, Dec: 32.0730, z = 0.027; (b) SDSS, RA: 160.5460, Dec: 23.7467, z = 0.012; (c) SDSS, RA: 245.5526, Dec: 27.3422, z = 0.096; (d) SDSS, RA: 161.5004, Dec: 9.1075, z = 0.087. Their images are presented in Figure 7. Interesting examples of galaxies are like double rings (‘a’ and ‘b’ in Figure 8) as well as systems, where the formation of a polar ring may be underway (‘c’ and ‘d’ in Figure 8).
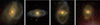 |
Fig. 7. Discovered PRGs from catalogue of SDSS ring galaxies after visual inspection: (a) RA: 149.7138, Dec: 32.0730, z = 0.027; (b) RA: 160.5460, Dec: 23.7467, z = 0.012; (c) RA: 245.5526, Dec: 27.3422, z = 0.096; (d) RA: 161.5004, Dec: 9.1075, z = 0.087. |
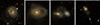 |
Fig. 8. Examples of double ring galaxies from the catalogue of ring galaxies by visual inspection (a) RA: 227.7441, Dec: 5.3180, z = 0.081; (b) RA: 138.8240, Dec: 18.0789, z = 0.056. Examples of galaxies with ring formation through merging from the catalogue of ring galaxies by visual inspection: (c) RA: 198.8077, Dec: 44.4073, z = 0.035; (d) RA: 198.6566, Dec: 26.1239, z = 0.073. |
6. Multiwavelength analysis of the discovered PRG SDSS J140644.42+471602.0
6.1. Data
The initial data for the galaxy SDSS J140644.42+471602.0 was obtained from the SDSS survey. However, data across the entire electromagnetic spectrum was required for a comprehensive multiwavelength analysis. We found that the GALEX and WISE space observatories also observed this galaxy. The standard circular apertures used for photometric measurements in these surveys differ in size: GALEX (UV) employs diameters of 12 arcsec for FUV and 34.5 arcsec for NUV bands; SDSS (optical) applies a 6-arcsecond aperture for all bands; WISE (IR) uses 16.5 arcsec for the W1, W2, and W3 bands and 33 arcsec for W4. The total size of the galaxy, including its ring, is ≈27 arcsec (see‘a’ in Figure 9).
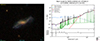 |
Fig. 9. PRG SDSS J140644.42+471602.0 discovered with transfer learning. (a) The image is obtained by the Aladin tool where the yellow line is the estimated line of sight size in the optical band. (b) Best approximation of the SED from UV to IR bands. Red dots are model fluxes; purple dots are observed fluxes. The green curve describes the nebular emission, the yellow curve – the stellar component without attenuation, the blue dashed curve describes the stellar component with attenuation, the red curve – dust radiation. The black curve is the resulting model SED. |
The preprocessed, cleaned, and calibrated UV (GALEX) and IR (WISE) images of the galaxy were downloaded from the IRSA archive8 and the optical (SDSS) images from the SDSS. To further analyse these data, we used the Aperture Photometry Tool (APT) v. 3.0.89 Laher et al. (2012) to derive the magnitudes from these images accurately. Since the observed size of the galaxy varies across the wavelength bands, we used the radial profile and curve of growth to determine the optimal aperture size for source and background, as recommended in the APT guide. The final photometric values ensuring accurate background subtraction were obtained with the Sky average subtraction model, and more details of all available models can be found in the work by Laher et al. (2012).
For further multiwavelength analysis (Section 6.2), we consulted with the SDSS team to consider that SDSS magnitudes are asinh magnitudes and are related to flux through the inverse hyperbolic sine function. We encountered completely unphysical magnitude values when applying the Pogson equation with a zero point of 22.5. The resulting fluxes from UV to IR for the entire galaxy with a ring are given in Table 3: two UV bands (FUV and NUV); five SDSS bands (u, g, r, i, z), and four IR bands (W1, W2, W3, and W4). Galactic reddening and extinction were considered a k-correction based on the IRSA dust map10.
UV to IR k-corrected observed fluxes in mJy for SDSS J140644.42+471602.0.
6.2. Spectral energy distribution for SDSS J140644.42+471602.0
PRGs demonstrate a complex star formation history influenced by the formation of the central galaxy’s main stellar population and the subsequent formation of the polar ring. As a result, we have varying ages: an older population dominates the central galaxy, while a younger population is typically found in the polar ring. To obtain more detailed properties of SDSS J140644.42+471602, we exploited CIGALE software (Boquien et al. 2019) for multiwavelength analysis of spectral energy distribution (SED) from UV to IR spectral ranges with the following modules:
-
Star formation history was described with sfh2exp module, which has two exponential components. The first allowed us to describe the early stages of galaxy evolution and the initial burst of star formation. The second exponential component is responsible for star formation at the later evolutionary stages.
-
Stellar population was described with bc03 module Bruzual & Charlot (2003).
-
Nebular emission with nebular module simulates the ionisation spectrum that arises from young hot stars using results from the stellar population model by Inoue (2011).
-
Dust attenuation was taken into account with dustatt_modified_starburst module, based on the modified attenuation law (Calzetti et al. 2000; Leitherer et al. 2002). It uses modified absorption curves for different galaxy components, including young and old stellar populations.
-
Dust emission with dl2014 module describes the heating and radiation of interstellar dust in galaxies (Draine et al. 2014).
The Bayesian method selected the best model for the observed SED (Figure 9) from more than 1 billion possible combinations. The history of star formation is described by two exponential flares, as mentioned above. The E-folding time of the main stellar population is 500 Myr, which led to the formation of the stellar population in the central galaxy with a mass ofM M⊙ and an age of 8.5 Gyr. The second episode of star formation began 500 Myr ago with an E-folding time of 4 Gyr, leading to the formation of a younger stellar population, M
 M⊙.
M⊙.
The estimated E-folding time of the late stellar population suggests that the ring formed due to accretion from a satellite galaxy. This most likely led to its destruction, since the galaxy has no visible neighbours on the scale of 0.5 angular seconds. We also assume here that the formation of a polar ring resulted from a merger. Numerical simulations by Di Matteo et al. (2008) show that in the case of a merger, the E-folding time of the late stellar population should be less than 1 Gyr, and variants with larger values arise in the case of accretion. Now, the formation of new stars continues, consistent with the classification of this galaxy in the SDSS based on spectral data. The value of SFR in our model is SFR = 69.83 ± 3.49 M⊙ per year. This is only a rough estimate. Due to the lack of observational data in the FUV band, we cannot correctly estimate star formation since the radiation from young stars surrounded by a dust cocoon is not considered. The estimated total mass of the stellar component is Mstar = 8.48 ± 0.62 ⋅ 1010 M⊙ and the dust mass based on this model is Mdust = 1.8 ± 1.0 ⋅ 107 M⊙.
Reshetnikov & Combes (2015) calculated SFRs for 50 PRGs, which range from 0.01 to 30.0 M⊙ per year. Lackey et al. (2024) analysed the emission from five PRGs and estimated their stellar masses to be in the range of 1010 − 1011 M⊙ with stellar population ages in the rings of 5–6 Gyr. Given the rarity of PRGs, we cannot define statistically significant typical values with certainty. However, the properties we obtained for PRG SDSS J140644.42+471602.0 are broadly consistent with those reported in these studies.
7. Summary of results and conclusions
7.1. Catalogue of inspected polar ring galaxies
Our catalogue of inspected PRGs consists of 179 objects:
-
166 objects that cover the categories of strong, good, and weak candidates based on the data by (Whitmore et al. 1990; Moiseev et al. 2011; Reshetnikov & Mosenkov 2019), which have high-quality SDSS images;
-
three objects found by Skryabina et al. (2024), one PRG discovered by Akhil et al. (2024a), one PRG confirmed by Freitas-Lemes et al. (2024), and one PRG discovered by Stanonik et al. (2009);
-
three PRGs discovered by us with a deep learning approach (Sections 3 and 4) and four PRGs found visually from the catalogue of SDSS ring galaxies (Section 5).
The preliminary PRG sample (Section 2) also includes 108 objects of the southern sky, and their validation is in progress. Figure 10 and Figure 11 demonstrate the distribution of these PRGs by redshift, located mostly in the Local Volume, as well as the dependence of magnitude vs. redshift in the r-filter, respectively. This catalogue will be supplemented in VizieR.
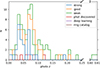 |
Fig. 10. Distribution of inspected PRGs by redshift. |
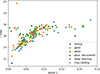 |
Fig. 11. Dependence of magnitude vs. redshift in r-filter for inspected PRGs. |
7.2. Nuclear activity
Another interesting feature of PRGs is their activity both star-forming and nuclear, which is connected with the inflow of matter from the polar ring to the central black hole, for example, the famous UGC 11397, the active nucleus of which was photographed by the Hubble Space Telescope11. There is an excess of Seyfert and LINER types of active nuclei among forming PRGs. However, the star formation rate in the polar rings is similar to that in normal late-type spiral galaxies (Smirnov & Reshetnikov 2020). Using spectroscopic and shear catalogues for SDSS galaxies in the Local Universe, Zhang et al. (2021) obtained the support of a scenario in which interactions between a central galaxy and its satellites trigger an early episode of star formation and nuclear activity, followed by multiple AGN cycles driven by the asymmetric structure formed during the interaction.
Since it remains unclear whether gravitational interactions with satellite galaxies significantly affect AGN activity, we decided to analyse the available SDSS spectra for our PRG catalogue.
Using the AstroPy library, we performed individual SQL queries by coordinates with a search radius of 0.01 degrees. Out of the 179 galaxies in the catalogue, we obtained spectra for 121. For each object, we extracted the fluxes of the Hα, Hβ, [NII]λ6584, and [OIII]λ5007 lines, which are the standard inputs for the Baldwin–Phillips–Terlevich (BPT) diagnostic diagram Baldwin et al. (1981). Additionally, we applied the demarcation curves from Kewley et al. (2001), Kauffmann et al. (2003), and Schawinski et al. (2007) to classify the PRG as star-forming, Seyfert, LINER, or composite. As a result, we obtained that among the 121 PRGs are: Star-forming galaxies – 42; Composite galaxies – 43; Linear galaxies – 19; Seyfert galaxies – 17 (Fig. 12).
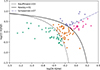 |
Fig. 12. BPT diagram for 121 PRGs with available SDSS spectra from our catalogue. |
Thus, we found that 64% of PRGs exhibit signs of nuclear activity. This may provide additional support for the hypothesis proposed by Smirnov & Reshetnikov (2020), suggesting that the observed nuclear activity in PRGs could be linked to gas accretion from the polar structures onto the central galaxy.
7.3. Isolation test
PRGs have not been found in galaxy clusters, which distinguishes them from ordinary S0 galaxies. This is most likely due to the rapid destruction of rings in clusters. The formation of a polar ring by the capture of matter from another nearby galaxy by host galaxy is possible if two conditions are met: (1) low gas density in the plane of the host galaxy; (2) when the plane of the ring being formed is perpendicular to the plane of the host galaxy as the most dynamically stable position. If the first condition is not met, the dense gas in the plane of the dominant galaxy slows down the capture gas, and the polar ring is not formed at all. This explains the absence of polar rings in gas-rich spiral galaxies, although there are exceptions (e.g., mentioned in Section 1). If the second condition is violated, the formed polar ring collapses due to interaction with the disc of the dominant galaxy or with its close galactic environment, already at the formation stage. For example, Finkelman et al. (2012) found that PRGs preferentially settle in low-density environments compared to other early-type galaxy samples. They explained this result by a natural selection effect; in many PRGs, the luminous polar structure extends much farther than the host galaxy and could be destroyed more easily by close-neighbour galaxies. Another case was described by Freitas-Lemes et al. (2014), whose spectroscopic study revealed that one of the neighbouring galaxies may have interacted with the AM2217-490 system, donating material to form the ring of this PRG under construction.
We performed a neighbourhood search for each discovered PRG in our work (Table 4) using the SDSS DR18 spectroscopic catalogue. The SQL query for selected objects within a redshift range of z ± 0.002 and an angular radius corresponding to a chosen radius of Rphys = 3 Mpc on the projective plane. Only spectroscopically confirmed objects of class GALAXY, QSO, or AGN, with no spectroscopic warnings (zWarning = 0) and clean photometry (clean = 1), were considered. To filter out artefacts, stars, and other non-galactic objects, we additionally add a required morphological type of the galaxy. To avoid counting duplicate components of extended galaxy images as separate sources, objects within 3.5 arcsec of the target galaxy were excluded. Positional deduplication was performed within a 1 arcsec radius. The coordinates of galaxies were converted to a 3D comoving system (X, Y, Z) using Planck18 cosmology.
Environmental properties of the PRGs in the search radius 3 Mpc.
We estimated the local galaxy density based on such methods:
-
Calculation of density by distance to the most distant neighbours (ΣN) as:
 where N is the number of neighbours within Rphys, and Rmax is the maximal distance to the detected neighbours.
 -
Estimation of the local density via 2D and 3D Voronoi diagrams. The target galaxy is centred in a coordinate system. Objects with an insufficient number of neighbours (< 4 in 3D, < 2 in 2D) were excluded from the analysis. In this case, we estimated the local density based on the inverse area (2D) or volume (3D) of the Voronoi cell corresponding to the target galaxy: ΣVor, 2D = A−1, ΣVor, 3D = V−1.
The use of 3D Voronoi tessellation for estimation of the local environment of galaxies was proposed by Elyiv et al. (2009), Vavilova et al. (2021c). To implement a classification into types of local environment based on the obtained density, we relied on the research by Poggianti et al. (2008), Poggianti et al. (2010), and Cautun et al. (2014). As a consequence, the PRG environments, according to the following empirical thresholds, were classified: isolation (Σ < 0.05); low density (0.05 ≤ Σ < 0.5); group (0.5 ≤ Σ < 2.0); cluster (Σ ≥ 2.0).
The application of the Voronoi method did not allow us to estimate the density for most galaxies due to the insufficient number of neighbours within the given search radius. Table 4 shows only the ΣN. According to the results of the Voronoi method, all seven discovered galaxies can be classified as having a lower local density.
7.4. Multiwavelength analysis
Data availability across different electromagnetic spectrum ranges enables multiwavelength analysis using the CIGALE program. However, there are no observations in the far-infrared and radio bands for most newly identified PRGs. This limitation affects the accurate estimation of the star formation rate in these galaxies, as the absence of such data prevents a proper accounting of contributions from star-forming regions that may be embedded in dust. Nevertheless, we found that 17 studied PRGs exhibit a significant scatter in their neutral hydrogen content related to the stellar mass, with HI mass ranging from 0.063% to 63% of the stellar mass across different galaxies. Some of these galaxies appear very bright on UV images from the GALEX space observatory, indicating a large amount of gas and potentially active star formation.
Here, we test a new approach for multiwavelength analysis of PRGs. Since line-of-sight sizes are bigger than standard aperture sizes for different space and ground observatories, we used the Aperture Photometry Tool (APT) v. 3.0.8 Laher et al. (2012) to obtain accurate photometry in each band. We have analysed a new PRG, SDSS J140644.42+471602.0, with CIGALE software. The results suggest that the galaxy’s stellar population formed in two main episodes: an older population with an e-folding time of 500 Myr and a younger population formed 500 Myr ago with an e-folding time of 4 Gyr. The formation of the polar ring is most likely due to accretion from a satellite galaxy rather than a merger. The current SFR for this PRG is 71 M⊙ per year, although the lack of FUV data limits this estimate. The total stellar mass is estimated to be M = 5.84 ± 0.62 ⋅ 1010 M⊙, with a dust mass of Mdust = 1.8 ± 1.0 ⋅ 107 M⊙. The predominance of an old stellar population (two-thirds of the total mass) suggests that this PRG was undergoing interaction processes (see, for example, Freitas-Lemes et al. 2024 for ESO 287-IG50).
7.5. Deep learning approach for PRG search
For the first time, we applied machine learning image-based methods to the PRG search, even though only about 463 PRG candidates are currently known. This risk turned out to be justified: we discovered three PRGs. Because we cannot compare our results with others, we discuss and summarise the methodology of our approach.
We examined the SDSS sample of high-quality galaxy images; nevertheless, that training sample was extremely limited by 87 PRGs (we did not include even weak PRG candidates because we wanted the neural network to operate with well-defined images). Moreover, we expected that training on such a small sample of images would likely lead to overfitting. Therefore, developing a functional neural network approach for this problem requires employing various techniques to address the significant class imbalance.
We attempted to solve this problem in several ways. We need to increase the training sample. Firstly, we used augmentation, which gave a good result in our previous works (Khramtsov et al. 2022). We applied PyTorch (Paszke et al. 2019), which has built-in augmentation functions. This technique artificially increases the size of the dataset by generating different versions of the original images using operations such as rotation, flipping, scaling, and colour adjustment. These additions help the model learn more generalised features, thereby improving its ability to recognise PRGs in various contexts. In addition, we used image segmentation, which helped isolate the regions of interest and concentrate on the PRGs. This approach reduces noise and improves the accuracy of the feature extraction process. Furthermore, we implemented an ensemble of models to boost classification performance. Ensemble learning involves combining the predictions of multiple models to produce a final prediction. This technique mitigates the risk of relying on a single model, which might be prone to overfitting or underfitting. For example, we achieved a more balanced and reliable classification outcome by averaging the predictions from various models. In the result of this ensemble approach at the first stage, 494 galaxies from ≈315 000 were classified as PRG with scores higher than 0.9. However, upon visual inspection, none of these galaxies exhibited the characteristics of PRGs.
Another independent approach was that a shallow neural network with one hidden layer was trained, where we also used augmentation, but slightly differently; PRG images were increased by 25 times through data augmentation. When applied to a representative SDSS dataset, the model made numerous false-positive predictions. We selected 25 potential candidates for visual inspection with an accuracy of 0.94 to be PRG or related objects. As a result, we have found a pair of galaxies (second row in Figure 4) with a ring pattern. Since they are fairly closed, this pair should be investigated in more detail. If a more detailed analysis confirms that there is a ring in this pair (second row in Figure 4), this option can be considered as additional information for the formation of PRGs due to the merger process (Schweizer et al. 1983; Bekki 1997, 1998; Akhil et al. 2024a) or by the gas action of the donor galaxy on the dominant galaxy Bournaud & Combes (2003), Ordenes-Briceño et al. (2016). Freitas-Lemes et al. (2024) explored the peculiar galaxy ESO 287-IG50 (PRG candidate from the Atlas by Whitmore et al. (1990). Their photometry and spectroscopic analysis led to the conclusion that this PRG is in an ongoing formation process.
As a final method to solve the problem of insufficient training sample, we attempted transfer learning – training using synthetic images generated via GALFIT (Peng et al. 2002). Krishnakumar & Kalmbach (2024) utilised transfer learning to train a CNN to identify ring galaxies. They used a modified GalSim code Ghosh et al. (2020) to generate a sample of simulated ring galaxies and then run GALFIT, allowing for an automatic generation of the required number of images. We also followed a similar path and created a chosen number of GALFIT input files with the simulation parameters. Then, GALFIT is run on these files, producing the simulated images. Lastly, the noise is added to the images, and conversion from FITS to JPG is done.
Our model, again, overfits the data during the training process, as in the previous run, but we decided to test the final model on a Vavilova et al. (2021a) sample with more than 300k galaxies from SDSS. We have visually inspected galaxies with an accuracy of 0.999 and found interesting results. The first promising sign is that the model selected many late spiral galaxies with tight spiral arms, which the model could probably confuse with rings. Secondly, the model chose a lot of regular ring galaxies and merging galaxies, which could be confused with having a ring-like structure.
So, our deep learning approach has resulted in the discovery of three PRGs, Number 1–3, from Table 4, as well as four PRGs, Number 4–7, from Table 4, which were discovered upon visual inspection of the catalogue of the SDSS ring galaxies.
Our outcome suggests that deep learning is a promising approach for PRGs search, requiring further refinement and potential enhancements to the developed methodology. Incorporating some additional information (photometry or spectroscopic data) will enable a hybrid analysis (see, for example, Gutiérrez & Hervás-Martínez 2011). Another promising way is to generate new training samples using contemporary Generative Adversarial Networks (see, for example, Goodfellow et al. 2014; Vavilova et al. 2018). The GANs can create realistic synthetic data for wider existing datasets, thereby dealing with the issue of limited and imbalanced data and helping with the generalisation and robustness of the model. In both cases, the catalogue of inspected PRG images, being supplemented with newly discovered objects, will become quite helpful for the CNN approach and theoretical studies. These strategies represent valuable opportunities for future development, aiming to push the boundaries of our current model and to reach more reliable identification of PRGs in big current and future sky surveys.
Analysing the first photographic atlas of PRGs, Whitmore et al. (1990) supposed that 5% of S0 galaxies had polar rings at some point in their evolutionary history. This estimation was based on the fraction of currently known PRGs, the assumed time of life of a PRG, correction for disadvantageous viewing conditions, and the chance of the galaxy encounter resulting in a PRG. Further optical observations have revealed polar rings around roughly 0.5% of the nearby lenticular galaxies, as well as ellipticals and even spirals. The existence of HI polar rings around galaxies discovered in the radio range, new possibilities of artificial intelligence methods to discover PRGs, which we have demonstrated in this article, prove that PRGs are more common than previously thought.
Data availability
Catalogue of inspected PRGs (CIPRG) is available at the CDS via https://cdsarc.cds.unistra.fr/viz-bin/cat/J/A+A/702/A258.
Acknowledgments
The research by Dobrycheva D.V., Hetmantsev O.O., Vavilova I.B., and Kompaniiets O.V. was supported by the project (ID 848), which is conducted in the frame of the EURIZON program funded by the European Union under grant agreement No.871072. The research by Dobrycheva D.V., Vavilova I.B. was supported by the National Research Foundation of Ukraine (project 2023.03/0188). The work of Gugnin O. was partially supported by the Ministry of Education and Science of Ukraine (project 25BF051-04). We thank Prof. J. Knapen and Prof. J. Beckman (IAC, Spain) and Prof. M. Kowalski (DESY, Germany) for fruitful seminars and discussions in March 2025, when the results of this research were finalized. Our sincere gratitude to the reviewer for helpful remarks, which improved our article.
References
- Akhil, K. R., Kartha, S. S., & Mathew, B. 2024a, MNRAS, 530, 2907 [Google Scholar]
- Akhil, K. R., Kartha, S. S., Mathew, B., et al. 2024b, A&A, 681, A35 [NASA ADS] [CrossRef] [EDP Sciences] [Google Scholar]
- Akhil, K. R., Kartha, S. S., Krishnan, U., et al. 2025, PASA, 42, e056 [Google Scholar]
- Argo, M. K., van Bemmel, I. M., Connolly, S. D., & Beswick, R. J. 2015, MNRAS, 452, 1081 [Google Scholar]
- Arp, H. C., & Madore, B. 1987, A catalogue of southern peculiar galaxies and associations (Cambridge; New York : Cambridge University Press) [Google Scholar]
- Astropy Collaboration (Price-Whelan, A. M., et al.) 2018, AJ, 156, 123 [Google Scholar]
- Bahr, S., & Mosenkov, A. 2024, Am. Astron. Society Meeting Abstr., 56, 408.04 [Google Scholar]
- Baldwin, J. A., Phillips, M. M., & Terlevich, R. 1981, PASP, 93, 5 [Google Scholar]
- Bekki, K. 1997, ApJ, 490, L37 [NASA ADS] [CrossRef] [Google Scholar]
- Bekki, K. 1998, ApJ, 499, 635 [CrossRef] [Google Scholar]
- Bertola, F., & Galletta, G. 1978, ApJ, 226, L115 [NASA ADS] [CrossRef] [Google Scholar]
- Bertola, F., Galletta, G., & Zeilinger, W. W. 1985, ApJ, 292, L51 [Google Scholar]
- Bertsik, P. P., & Kolesnik, I. G. 1992, Kinematika i Fizika Nebesnykh Tel, 8, 92 [Google Scholar]
- Bettoni, D., & Galletta, G. 2001, ASP Conf. Ser., 230, 433 [Google Scholar]
- Beygu, B., Jarrett, T., Jarrett, T., et al. 2011, Spitzer Proposal ID, 80069, 80069 [Google Scholar]
- Beygu, B., Peletier, R. F., van der Hulst, J. M., et al. 2017, MNRAS, 464, 666 [NASA ADS] [CrossRef] [Google Scholar]
- Boquien, M., Burgarella, D., Roehlly, Y., et al. 2019, A&A, 622, A103 [NASA ADS] [CrossRef] [EDP Sciences] [Google Scholar]
- Bournaud, F., & Combes, F. 2003, A&A, 401, 817 [NASA ADS] [CrossRef] [EDP Sciences] [Google Scholar]
- Bradley, L., Sipőcz, B., Robitaille, T., et al. 2024, https://doi.org/10.5281/zenodo.10967176 [Google Scholar]
- Brook, C. B., Governato, F., Quinn, T., et al. 2008, ApJ, 689, 678 [NASA ADS] [CrossRef] [Google Scholar]
- Bruzual, G., & Charlot, S. 2003, MNRAS, 344, 1000 [NASA ADS] [CrossRef] [Google Scholar]
- Calzetti, D., Armus, L., Bohlin, R. C., et al. 2000, ApJ, 533, 682 [NASA ADS] [CrossRef] [Google Scholar]
- Cautun, M., van de Weygaert, R., Jones, B. J. T., & Frenk, C. S. 2014, MNRAS, 441, 2923 [Google Scholar]
- Deg, N., Palleske, R., Spekkens, K., et al. 2023, MNRAS, 525, 4663 [CrossRef] [Google Scholar]
- Di Matteo, P., Bournaud, F., Martig, M., et al. 2008, A&A, 492, 31 [NASA ADS] [CrossRef] [EDP Sciences] [Google Scholar]
- Dobrycheva, D. V., Vavilova, I. B., Melnyk, O. V., & Elyiv, A. A. 2018, Kin. Phys. Celestial Bodies, 34, 290 [Google Scholar]
- Draine, B. T., Aniano, G., Krause, O., et al. 2014, ApJ, 780, 172 [Google Scholar]
- Elyiv, A., Melnyk, O., & Vavilova, I. 2009, MNRAS, 394, 1409 [NASA ADS] [CrossRef] [Google Scholar]
- Fang, G., Ba, S., Gu, Y., et al. 2023, AJ, 165, 35 [NASA ADS] [CrossRef] [Google Scholar]
- Finkelman, I., Funes, J. G., & Brosch, N. 2012, MNRAS, 422, 2386 [NASA ADS] [CrossRef] [Google Scholar]
- Freitas-Lemes, P., da Rocha-Poppe, P. C., Faúndez-Abans, M., et al. 2024, Ap&SS, 369, 93 [Google Scholar]
- Freitas-Lemes, P., Rodrigues, I., Faúndez-Abans, M., & Dors, O. 2014, Rev. Mex. Astron. Astrofis. Conf. Ser., 44, 177 [Google Scholar]
- Ghosh, A., Urry, C. M., Wang, Z., et al. 2020, ApJ, 895, 112 [NASA ADS] [CrossRef] [Google Scholar]
- Goodfellow, I., Pouget-Abadie, J., Mirza, M., et al. 2014, Advances in neural information processing systems, 2672 [Google Scholar]
- Grossi, M. 2019, IAU Symp., 344, 319 [Google Scholar]
- Gutiérrez, P. A., & Hervás-Martínez, C. 2011, in Advances in Computational Intelligence, eds. J. Cabestany, I. Rojas, & G. Joya (Berlin, Heidelberg: Springer), 177 [Google Scholar]
- Haud, U. 1988, A&A, 198, 125 [NASA ADS] [Google Scholar]
- Helmi, A., Babusiaux, C., Koppelman, H. H., et al. 2018, Nature, 563, 85 [Google Scholar]
- Huertas-Company, M., & Lanusse, F. 2023, PASA, 40, e001 [NASA ADS] [CrossRef] [Google Scholar]
- Ibata, R. A., Irwin, M. J., Lewis, G. F., Ferguson, A. M. N., & Tanvir, N. 2003, MNRAS, 340, L21 [Google Scholar]
- Inoue, A. K. 2011, MNRAS, 415, 2920 [NASA ADS] [CrossRef] [Google Scholar]
- Kauffmann, G., Heckman, T. M., Tremonti, C., et al. 2003, MNRAS, 346, 1055 [Google Scholar]
- Kewley, L. J., Dopita, M. A., Sutherland, R. S., Heisler, C. A., & Trevena, J. 2001, ApJ, 556, 121 [Google Scholar]
- Keys, R. 1981, IEEE Trans. Acoust. Speech Signal Proc., 29, 1153 [Google Scholar]
- Khramtsov, V., Vavilova, I. B., Dobrycheva, D. V., et al. 2022, Space Sci. Technol., 28, 27 [Google Scholar]
- Kingma, D., & Ba, J. 2015, in International Conference on Learning Representations (ICLR) (CA, USA, San Diega) [Google Scholar]
- Kreckel, K., van Gorkom, J. H., Beygu, B., et al. 2016, IAU Symp., 308, 591 [Google Scholar]
- Krishnakumar, H., & Kalmbach, J. B. 2024, AJ, 168, 191 [Google Scholar]
- Lackey, K., Kulkarni, V., & Aller, M. A. A. S. 2023, Meeting Abstracts, 55, 333.02 [Google Scholar]
- Lackey, K. E., Kulkarni, V. P., & Aller, M. C. 2024, Galaxies, 12, 42 [Google Scholar]
- Laher, R. R., Gorjian, V., Rebull, L. M., et al. 2012, PASP, 124, 737 [NASA ADS] [CrossRef] [Google Scholar]
- Lauberts, A. 1982, ESO/Uppsala survey of the ESO(B) atlas [Google Scholar]
- Leitherer, C., Li, I. H., Calzetti, D., & Heckman, T. M. 2002, ApJS, 140, 303 [NASA ADS] [CrossRef] [Google Scholar]
- Lintott, C., Schawinski, K., Bamford, S., et al. 2011, MNRAS, 410, 166 [Google Scholar]
- Loshchilov, I., & Hutter, F. 2019, arXiv e-prints [arxiv:1711.05101] [Google Scholar]
- Macciò, A. V., Moore, B., & Stadel, J. 2006, ApJ, 636, L25 [CrossRef] [Google Scholar]
- Mahdi Ali, S. 2021, J. Phys. Conf. Ser., 1897, 012070 [Google Scholar]
- Melnyk, O. V., Dobrycheva, D. V., & Vavilova, I. B. 2012, Astrophysics, 55, 293 [Google Scholar]
- Moiseev, A. V., Smirnova, K. I., Smirnova, A. A., & Reshetnikov, V. P. 2011, MNRAS, 418, 244 [CrossRef] [Google Scholar]
- Mosenkov, A. V., Bahr, S. K. H., Reshetnikov, V. P., Shakespear, Z., & Smirnov, D. V. 2024, A&A, 681, L15 [NASA ADS] [CrossRef] [EDP Sciences] [Google Scholar]
- Naidu, R. P., Conroy, C., Bonaca, A., et al. 2021, ApJ, 923, 92 [NASA ADS] [CrossRef] [Google Scholar]
- Nilson, P. 1973, Uppsala general catalogue of galaxies [Google Scholar]
- Ordenes-Briceño, Y., Georgiev, I. Y., Puzia, T. H., Goudfrooij, P., & Arnaboldi, M. 2016, A&A, 585, A156 [NASA ADS] [CrossRef] [EDP Sciences] [Google Scholar]
- Paszke, A., Gross, S., Massa, F., et al. 2019, in Advances in Neural Information Processing Systems (Curran Associates Inc), 32, 8024 [Google Scholar]
- Peng, C. Y., Ho, L. C., Impey, C. D., & Rix, H.-W. 2002, AJ, 124, 266 [Google Scholar]
- Poggianti, B. M., De Lucia, G., Varela, J., et al. 2010, MNRAS, 405, 995 [NASA ADS] [Google Scholar]
- Poggianti, B. M., Desai, V., Finn, R., et al. 2008, ApJ, 684, 888 [NASA ADS] [CrossRef] [Google Scholar]
- Pulatova, N. G., Vavilova, I. B., Sawangwit, U., Babyk, I., & Klimanov, S. 2015, MNRAS, 447, 2209 [Google Scholar]
- Reshetnikov, V., & Combes, F. 2015, MNRAS, 447, 2287 [NASA ADS] [CrossRef] [Google Scholar]
- Reshetnikov, V. P., & Mosenkov, A. V. 2019, MNRAS, 483, 1470 [NASA ADS] [CrossRef] [Google Scholar]
- Schawinski, K., Thomas, D., Sarzi, M., et al. 2007, MNRAS, 382, 1415 [Google Scholar]
- Schechter, P. L., & Gunn, J. E. 1978, AJ, 83, 1360 [NASA ADS] [CrossRef] [Google Scholar]
- Schweizer, F., Whitmore, B. C., & Rubin, V. C. 1983, AJ, 88, 909 [NASA ADS] [CrossRef] [Google Scholar]
- Sérsic, J. L. 1967, Z. Astrophys., 67, 306 [Google Scholar]
- Skryabina, M. N., Adams, K. R., & Mosenkov, A. V. 2024, MNRAS, 532, 883 [Google Scholar]
- Smirnov, D. V., Mosenkov, A. V., & Reshetnikov, V. P. 2024, MNRAS, 527, 4112 [Google Scholar]
- Smirnov, D. V., & Reshetnikov, V. P. 2020, Astron. Lett., 46, 501 [Google Scholar]
- Snaith, O. N., Gibson, B. K., Brook, C. B., et al. 2012, MNRAS, 425, 1967 [NASA ADS] [CrossRef] [Google Scholar]
- Stanonik, K., Platen, E., Aragón-Calvo, M. A., et al. 2009, ApJ, 696, L6 [NASA ADS] [CrossRef] [Google Scholar]
- Stockton, A., & MacKenty, J. W. 1983, Nature, 305, 678 [NASA ADS] [CrossRef] [Google Scholar]
- Varnas, S. R., Bertola, F., Galletta, G., Freeman, K. C., & Carter, D. 1987, ApJ, 313, 69 [Google Scholar]
- Vavilova, I., Dobrycheva, D., Vasylenko, M., Elyiv, A., & Melnyk, O. 2020, in Knowledge Discovery in Big Data from Astronomy and Earth Observation, eds. P. Škoda, & F. Adam, 307 [Google Scholar]
- Vavilova, I., Elyiv, A., Dobrycheva, D., & Melnyk, O. 2021c, in Intelligent Astrophysics, eds. I. Zelinka, M. Brescia, & D. Baron, 39, 57 [Google Scholar]
- Vavilova, I. B., Dobrycheva, D. V., Vasylenko, M. Y., et al. 2021b, A&A, 648, A122 [NASA ADS] [CrossRef] [EDP Sciences] [Google Scholar]
- Vavilova, I. B., Dobrycheva, D. V., Vasylenko, M. Y., et al. 2021a, VizieR Online Data Catalog: J/A+A/648/A122 [Google Scholar]
- Vavilova, I. B., Elyiv, A. A., & Vasylenko, M. Y. 2018, Radio Phys. Radio Astron., 23, 244 [Google Scholar]
- Vavilova, I. B., Fedorov, P. M., Dobrycheva, D. V., et al. 2024, Space Sci. Technol., 30, 81 [Google Scholar]
- Vavilova, I. B., Khramtsov, V., Dobrycheva, D. V., et al. 2022, Space Sci. Technol., 28, 03 [Google Scholar]
- Vavilova, I. B., Khramtsov, V., Dobrycheva, D. V., et al. 2023, VizieR Online Data Catalog: J/other/KNIT/28 [Google Scholar]
- Vavilova, I. B., Melnyk, O. V., & Elyiv, A. A. 2009, Astron. Nachr., 330, 1004 [Google Scholar]
- Whitmore, B. C., Lucas, R. A., McElroy, D. B., et al. 1990, AJ, 100, 1489 [NASA ADS] [CrossRef] [Google Scholar]
- Whitmore, B. C., McElroy, D. B., & Schweizer, F. 1987, ApJ, 314, 439 [NASA ADS] [CrossRef] [Google Scholar]
- Xu, Y., Hao, C. J., Liu, D. J., et al. 2023, ApJ, 947, 54 [NASA ADS] [CrossRef] [Google Scholar]
- Zhang, A., Kong, X., Liu, B., et al. 2025, ApJS, 279, 52 [Google Scholar]
- Zhang, Z., Wang, H., Luo, W., et al. 2021, A&A, 650, A155 [NASA ADS] [CrossRef] [EDP Sciences] [Google Scholar]
All Tables
All Figures
|
Fig. 1. Examples of PRG candidates identified by visual inspection: (a) Strong, RA: 24.7301, Dec: –7.7654, z = 0.035, kinematically confirmed by Whitmore et al. (1990); (b) Good, RA: 10.2643, Dec: –9.9411, z = 0.037 (Moiseev et al. 2011). |
| In the text | |
|
Fig. 2. Non-PRGs identified by visual inspection: (a) Ring, RA: 240.3706, Dec: 19.3598, z = 0.015 (Whitmore et al. 1990; b) Dust lane, RA: 173.1451, Dec: 53.0679, z = 0.0033 (Whitmore et al. 1990) more detail in Akhil et al. (2025); (c) Line of sight, RA: 349.5518, Dec: 4.1851, z = 0.040 (Whitmore et al. 1990); (d) Irregular, RA: 125.9668, Dec: 14.7521, z = 0.007 (Whitmore et al. 1990). |
| In the text | |
|
Fig. 3. Illustration of the segmentation process applied to a sample image from the training dataset. The leftmost image displays the original data point. The subsequent image demonstrates the background-subtracted data. This is followed by the mask delineating the defined central source. The rightmost image represents the segmented output, which we used as input for the neural network. The procedure was executed within a single colour channel. |
| In the text | |
|
Fig. 4. Discovered PRGs by machine learning (shallow neural network) with accuracy 0.94. First row: (left) SDSS image and (right) DESI Legacy Survey image of PRG with RA: 204.2103, Dec: 49.4625, z = 0.097. Second row: (left) SDSS image and (right) DESI Legacy Survey image of double PRG system with RA: 149.3220, Dec: 36.8315, z = 0.053 (centre) and RA: 149.3231, Dec: 36.8332, z = 0.054 (top). |
| In the text | |
|
Fig. 5. Distribution of CNN score for SDSS galaxies from catalogue by Vavilova et al. (2021a) to be PRG candidates. |
| In the text | |
|
Fig. 6. Examples of polar ring galaxy candidates identified by the CNN: (a) SDSS, RA: 173.8703, Dec: 38.5550, z = 0.022; (b) SDSS, RA: 151.3460, Dec: 19.2718, z = 0.013; (c) SDSS, RA: 165.7470, Dec: 34.9276, z = 0.032; (d) SDSS, RA: 222.8091, Dec: 35.5406, z = 0.004 (Reshetnikov & Combes 2015; e) SDSS, RA: 195.6699, Dec: 50.4401, z = 0.024. |
| In the text | |
|
Fig. 7. Discovered PRGs from catalogue of SDSS ring galaxies after visual inspection: (a) RA: 149.7138, Dec: 32.0730, z = 0.027; (b) RA: 160.5460, Dec: 23.7467, z = 0.012; (c) RA: 245.5526, Dec: 27.3422, z = 0.096; (d) RA: 161.5004, Dec: 9.1075, z = 0.087. |
| In the text | |
|
Fig. 8. Examples of double ring galaxies from the catalogue of ring galaxies by visual inspection (a) RA: 227.7441, Dec: 5.3180, z = 0.081; (b) RA: 138.8240, Dec: 18.0789, z = 0.056. Examples of galaxies with ring formation through merging from the catalogue of ring galaxies by visual inspection: (c) RA: 198.8077, Dec: 44.4073, z = 0.035; (d) RA: 198.6566, Dec: 26.1239, z = 0.073. |
| In the text | |
|
Fig. 9. PRG SDSS J140644.42+471602.0 discovered with transfer learning. (a) The image is obtained by the Aladin tool where the yellow line is the estimated line of sight size in the optical band. (b) Best approximation of the SED from UV to IR bands. Red dots are model fluxes; purple dots are observed fluxes. The green curve describes the nebular emission, the yellow curve – the stellar component without attenuation, the blue dashed curve describes the stellar component with attenuation, the red curve – dust radiation. The black curve is the resulting model SED. |
| In the text | |
|
Fig. 10. Distribution of inspected PRGs by redshift. |
| In the text | |
|
Fig. 11. Dependence of magnitude vs. redshift in r-filter for inspected PRGs. |
| In the text | |
|
Fig. 12. BPT diagram for 121 PRGs with available SDSS spectra from our catalogue. |
| In the text | |
Current usage metrics show cumulative count of Article Views (full-text article views including HTML views, PDF and ePub downloads, according to the available data) and Abstracts Views on Vision4Press platform.
Data correspond to usage on the plateform after 2015. The current usage metrics is available 48-96 hours after online publication and is updated daily on week days.
Initial download of the metrics may take a while.