Fig. 2.
Download original image
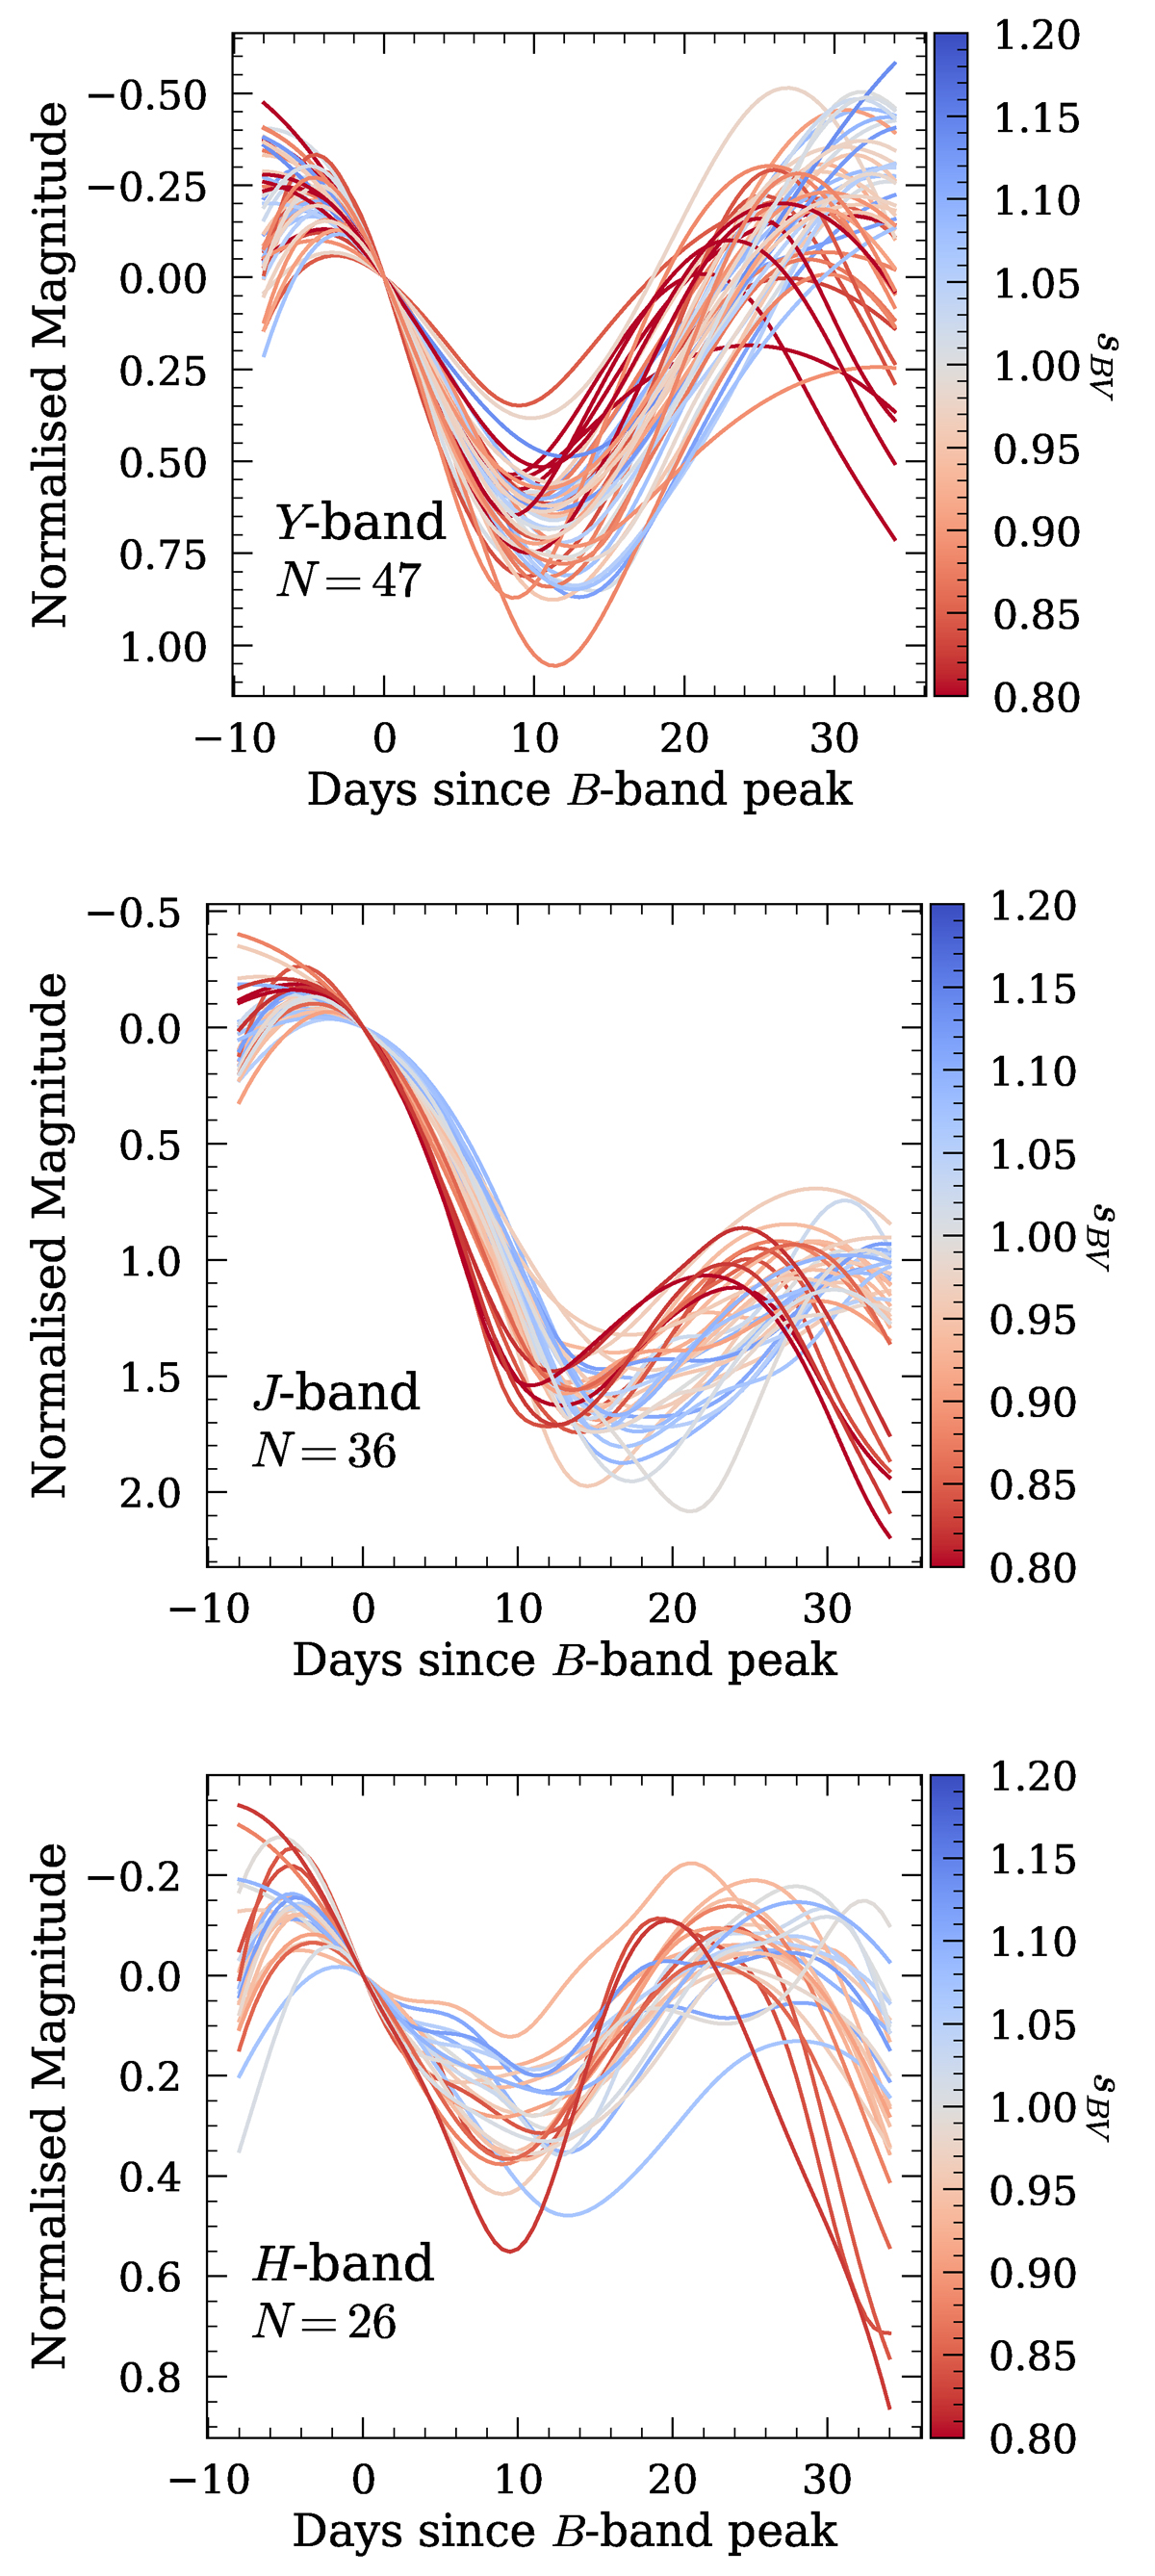
SNe Ia rest-frame light curves after the preprocessing steps of Sect. 5.1. The phase range covers from −8 to +34 days with respect to optical peak. The light curves are color-coded by sBV value, obtained with SNooPy fits using the max_model model, limiting the color range between 0.8 ≤ sBV ≤ 1.2 for visualization purposes, as the bulk of the sample falls within this range.
Current usage metrics show cumulative count of Article Views (full-text article views including HTML views, PDF and ePub downloads, according to the available data) and Abstracts Views on Vision4Press platform.
Data correspond to usage on the plateform after 2015. The current usage metrics is available 48-96 hours after online publication and is updated daily on week days.
Initial download of the metrics may take a while.