Fig. 3.
Download original image
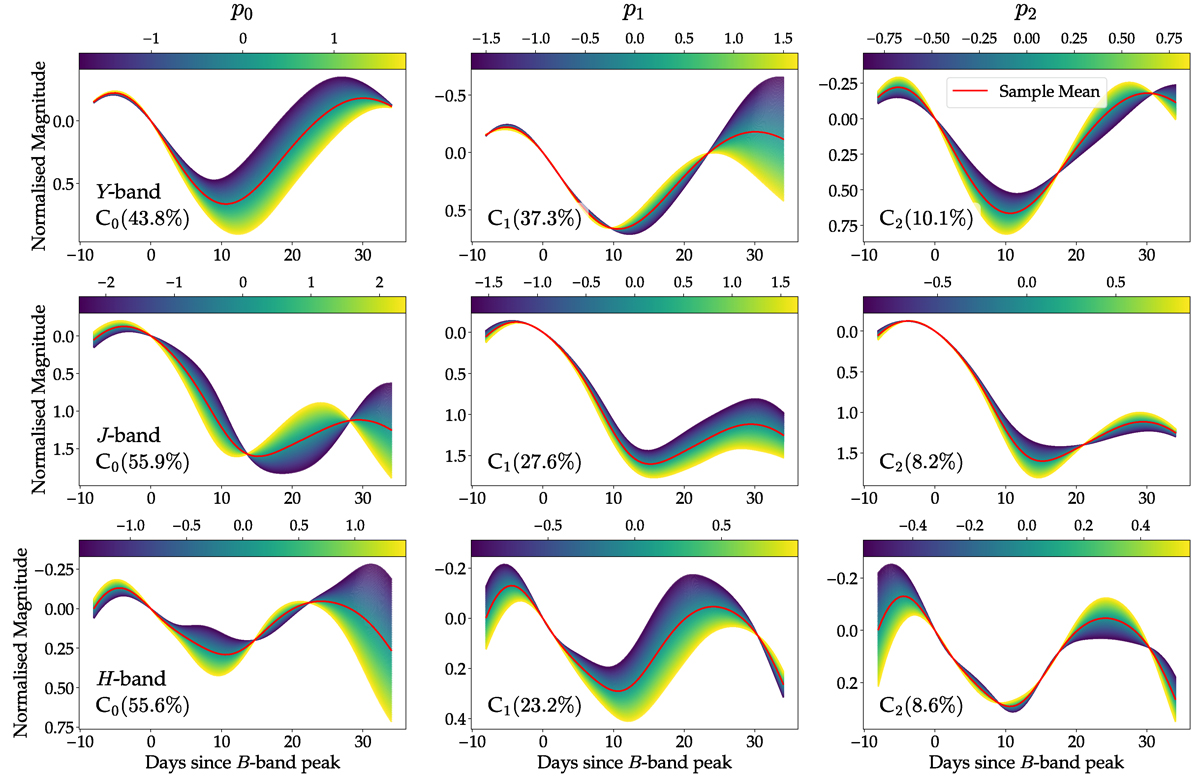
PCA decomposition for the Y- (top row), J- (middle row), and H-band (bottom row) light curves. Color-coded are the contributions of each of the coefficients with a 2σ range: p0 (left column), p1 (middle column), and p2 (right column). The sample mean is shown as a solid red line. The values in parentheses are the percentages of the explained variance. Three components explain ∼90% of the variance for each of the bands.
Current usage metrics show cumulative count of Article Views (full-text article views including HTML views, PDF and ePub downloads, according to the available data) and Abstracts Views on Vision4Press platform.
Data correspond to usage on the plateform after 2015. The current usage metrics is available 48-96 hours after online publication and is updated daily on week days.
Initial download of the metrics may take a while.