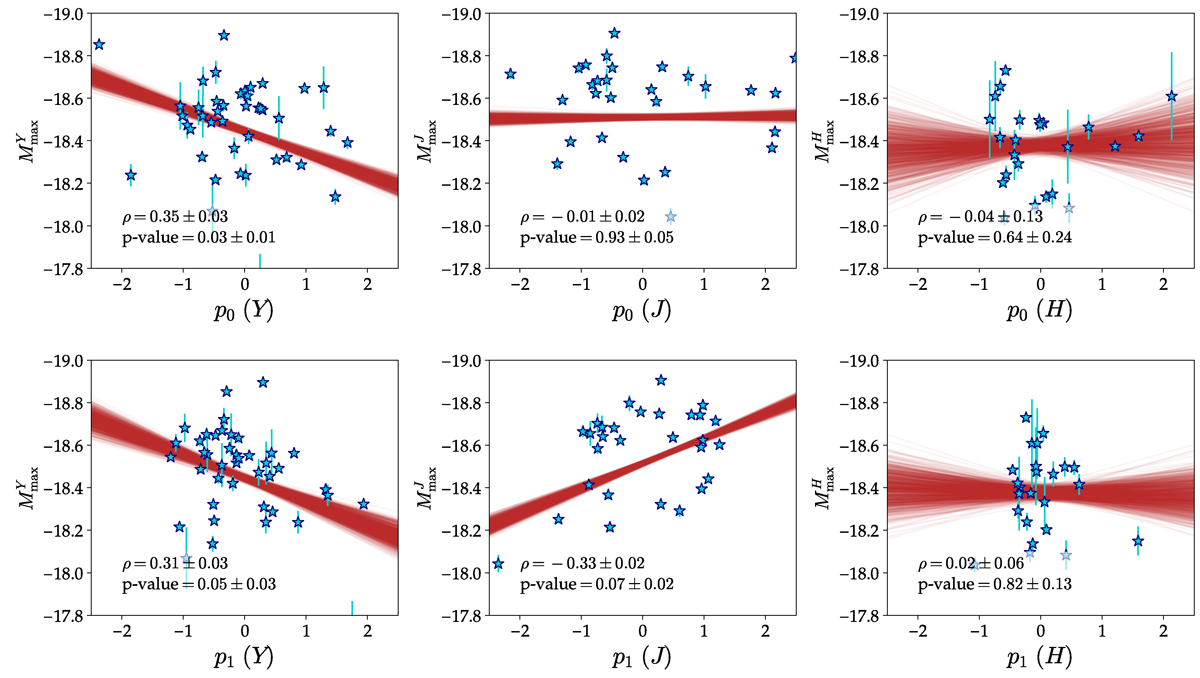
Fig. 4.
Download original image
Comparison of the first (p0; top row) and second (p1; bottom row) PCA coefficients vs. the peak absolute magnitude for each NIR band. The Pearson correlation coefficient (ρ) and p-value for each of the comparisons, with their respective 1σ uncertainty estimated by Monte-Carlo sampling, are shown with the respective linear relations (red lines). The null-hypothesis is that there is no correlation (zero slope). The panels have the same x- and y-axis ranges for visualization purposes.
Current usage metrics show cumulative count of Article Views (full-text article views including HTML views, PDF and ePub downloads, according to the available data) and Abstracts Views on Vision4Press platform.
Data correspond to usage on the plateform after 2015. The current usage metrics is available 48-96 hours after online publication and is updated daily on week days.
Initial download of the metrics may take a while.