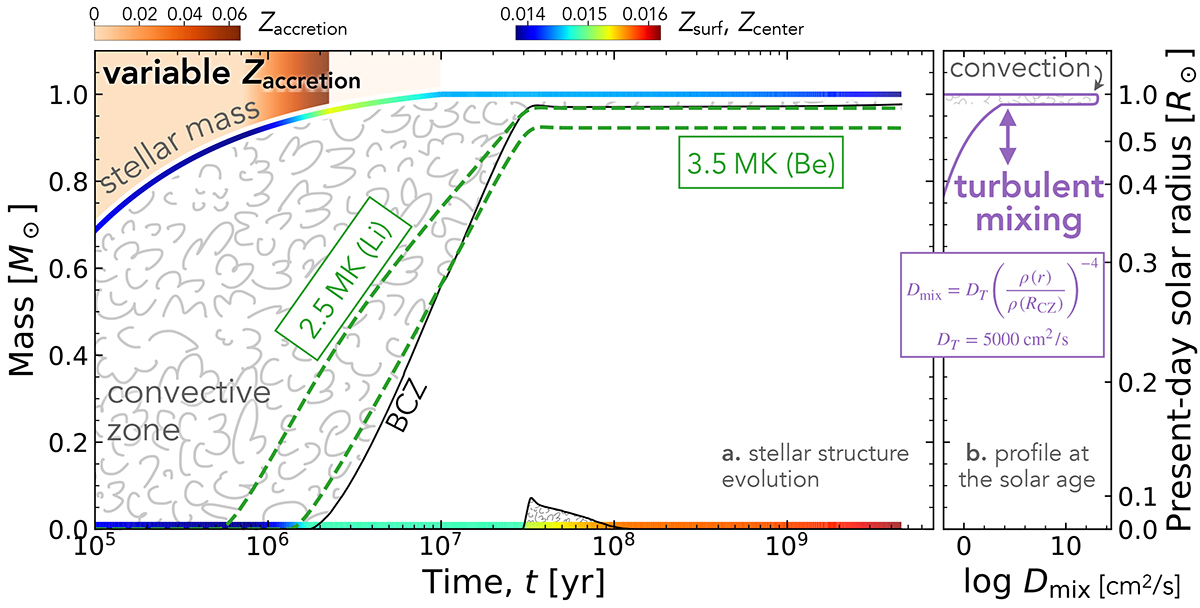
Fig. 1.
Download original image
Schematic illustration showing the structure evolution (panel a; the so-called Kippenhahn diagram) and the Dmix profile at the solar age (panel b) of our fiducial model, K2-MZvar-TM (see Table 2). The convective zones are depicted as a cloudy region. The color of the shade in panel a shows Zaccretion. The two lines at the stellar surface and center illustrate metallicity by color. The two dashed green lines the locations at temperatures 2.5 × 10⁶ and 3.5 × 10⁶ K, indicative of Li and Be burning, respectively.
Current usage metrics show cumulative count of Article Views (full-text article views including HTML views, PDF and ePub downloads, according to the available data) and Abstracts Views on Vision4Press platform.
Data correspond to usage on the plateform after 2015. The current usage metrics is available 48-96 hours after online publication and is updated daily on week days.
Initial download of the metrics may take a while.