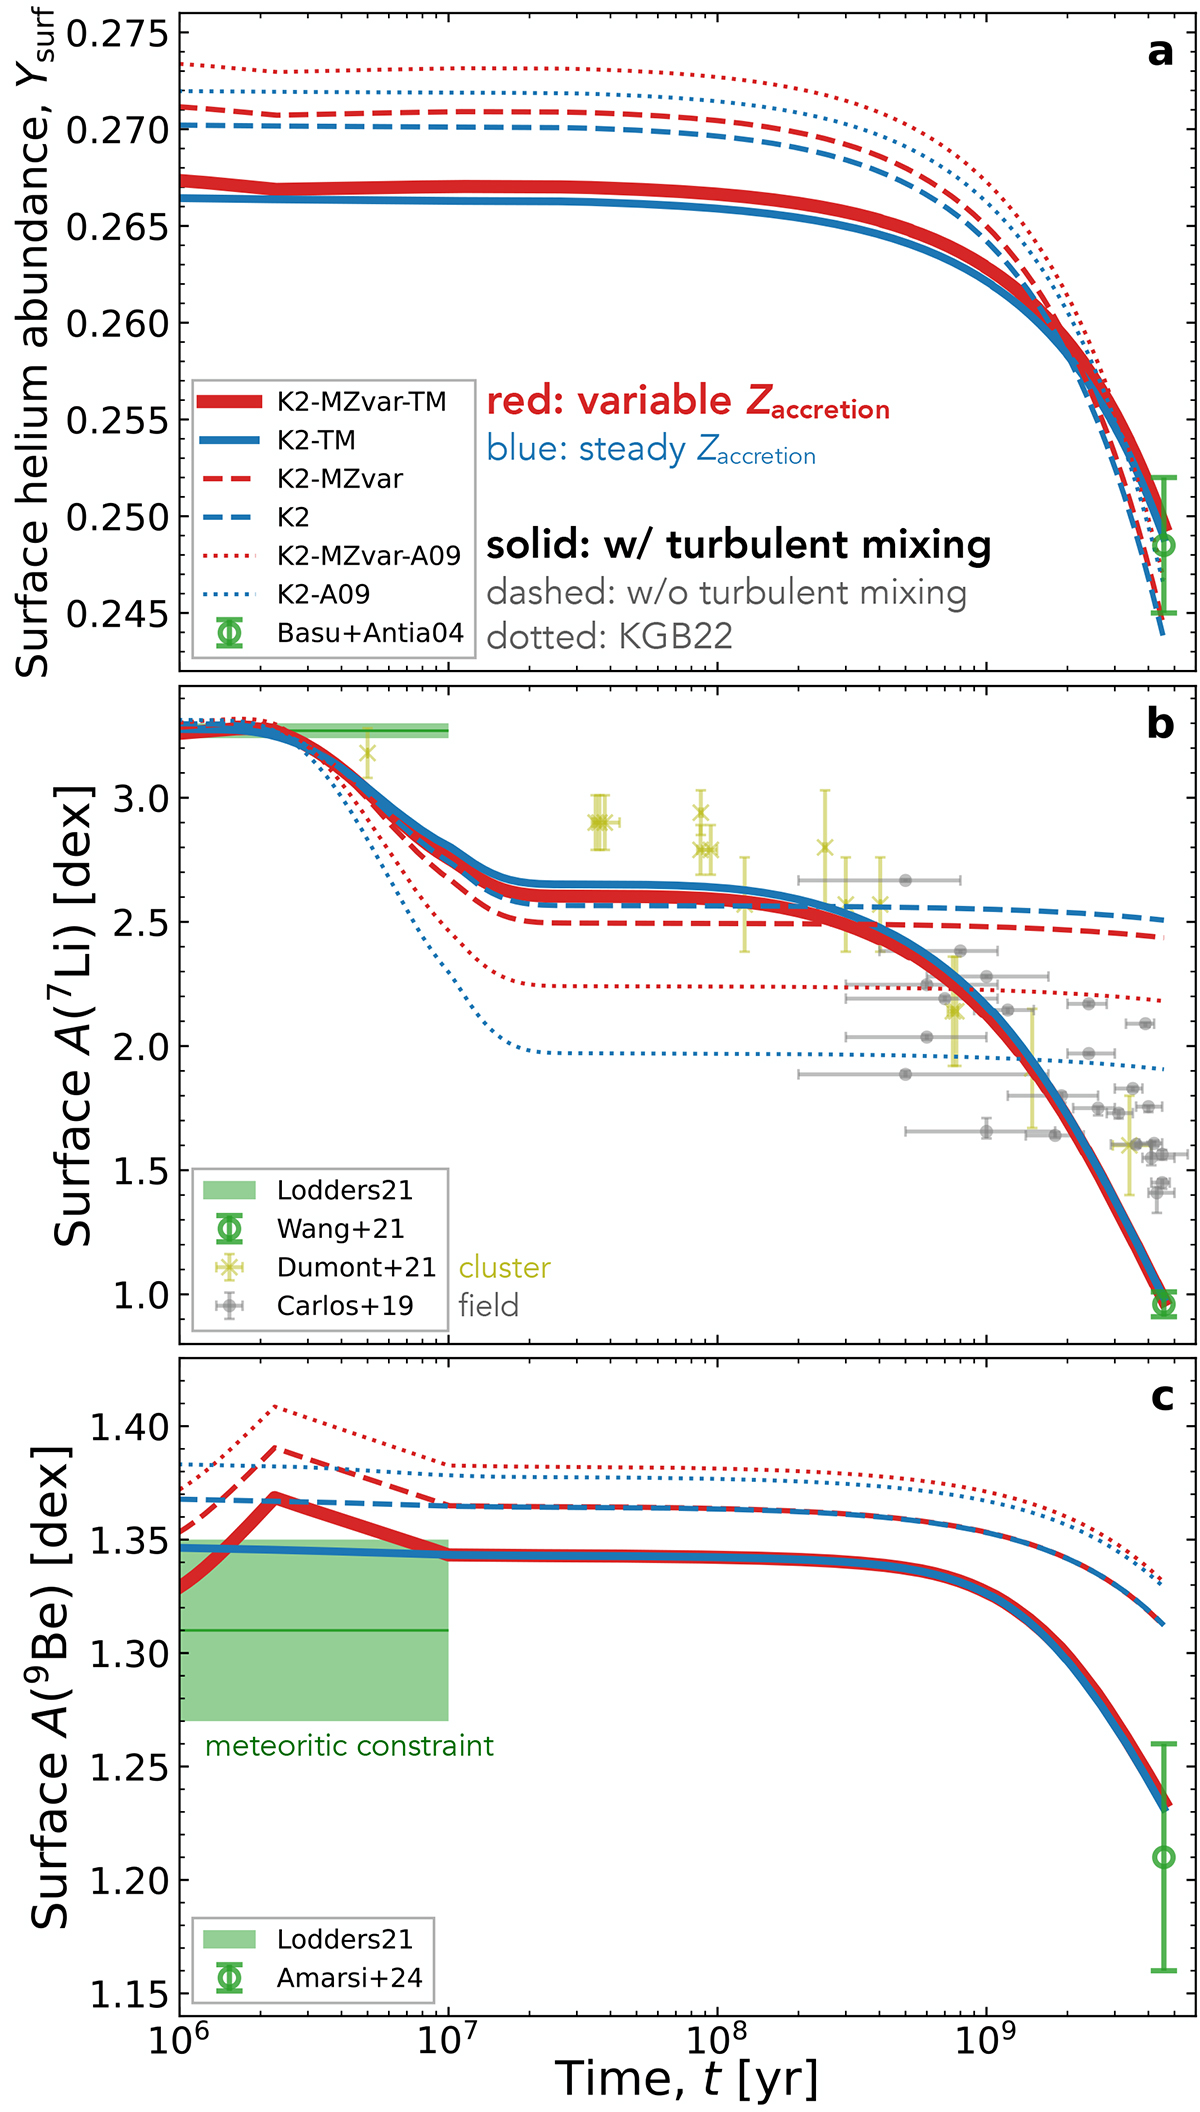
Fig. 2.
Download original image
Evolution of the surface abundances of helium (panel a), lithium (b), and beryllium (c). The red and blue lines show the models with variable and steady Zaccretion, respectively. The solid and dashed lines show the models with and without turbulent mixing, respectively. The dotted lines show the models from KGB22 (with AGSS09 abundances, without turbulent mixing but with overshooting). See Table 2 for more details. The green points show the observational constraints of the present-day Sun (see Table 1). The green shades show the meteoritic constraints (Lodders 2021) arbitrarily extending from 1 to 10 Myr. The crosses and small circles in panel b show the observed A(7Li) values of clusters (Dumont et al. 2021) and individual stars (Carlos et al. 2019), respectively, that are younger than the Sun.
Current usage metrics show cumulative count of Article Views (full-text article views including HTML views, PDF and ePub downloads, according to the available data) and Abstracts Views on Vision4Press platform.
Data correspond to usage on the plateform after 2015. The current usage metrics is available 48-96 hours after online publication and is updated daily on week days.
Initial download of the metrics may take a while.