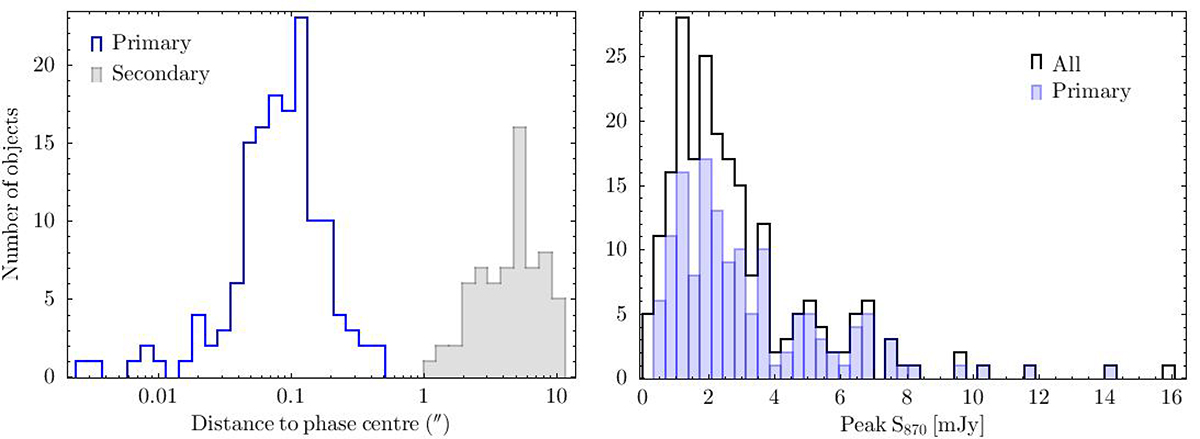
Fig. 2.
Download original image
Left: Histogram of the distance to the phase centre for the primary (open histogram) and secondary (grey histogram) counterparts. Right: Distribution of the Band 7 (870 μm) peak fluxes of the 209 ALMA sources in the 152 quasar fields (black histogram). Primary counterparts, that is, those extracted at the phase centre (i.e. at the optical coordinates of the quasars), are shown in a shaded histogram.
Current usage metrics show cumulative count of Article Views (full-text article views including HTML views, PDF and ePub downloads, according to the available data) and Abstracts Views on Vision4Press platform.
Data correspond to usage on the plateform after 2015. The current usage metrics is available 48-96 hours after online publication and is updated daily on week days.
Initial download of the metrics may take a while.