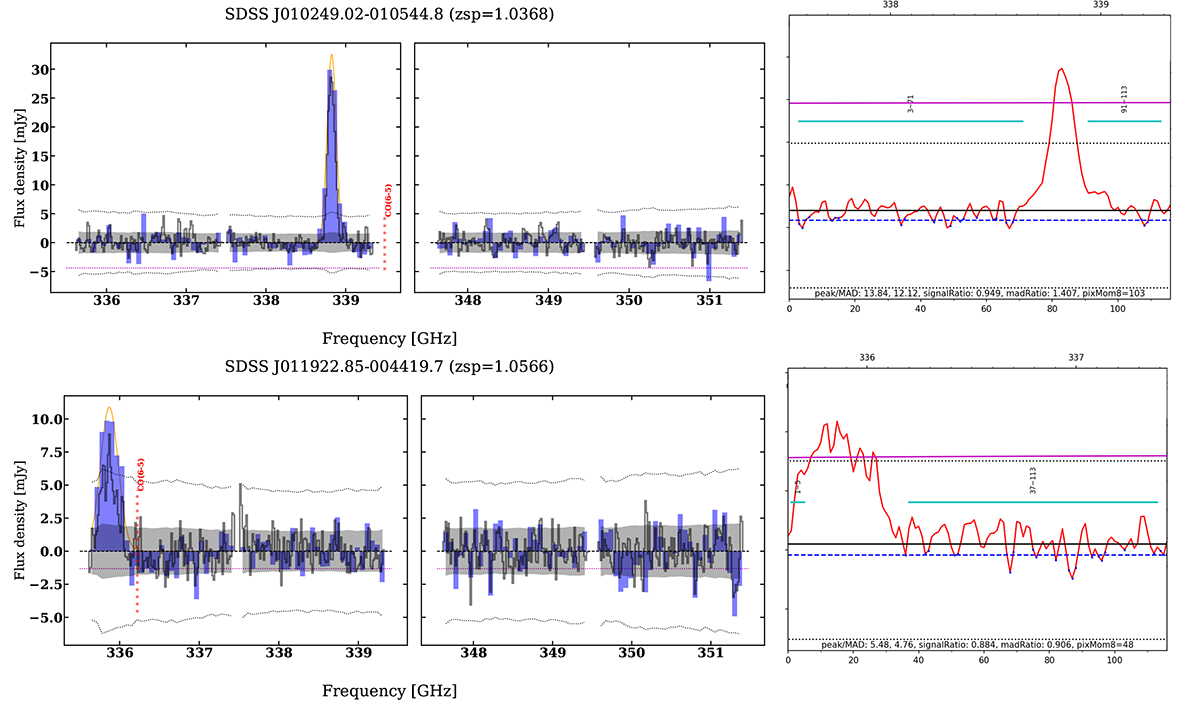
Fig. 5.
Download original image
Band 7 spectra of the two quasars with unambiguous CO(6–5) transition detections. Left and middle columns: Filled blue histograms show extracted spectra within the extraction aperture, smoothed to a spectral resolution of ∼111 km s−1, while the solid black histogram shows the raw-resolution spectra of the peak flux within the aperture (units of Jy/beam). The shaded grey regions represent per-channel ±1σ, while the dotted lines indicate the per-channel ±3σ level. The magenta line shows the continuum subtracted from the spectrum to assess the significance of absorption detections (none detected). Dashed red lines indicate the expected location of the CO transition shifted to the optical (SDSS) redshift of each object. The orange line shows the single-Gaussian fit to the line. Right column: ALMA pipeline continuum fitting output from the spectral window where the lines were identified. The binned spectrum in red; the region in which the continuum has been extracted is shown in cyan; and the level of the continuum is shown in black. The x axis at the bottom indicates the channels, and the x axis at the top indicates the frequency (in GHz). These plots were extracted directly from the logs of the pipeline runs (‘weblogs’).
Current usage metrics show cumulative count of Article Views (full-text article views including HTML views, PDF and ePub downloads, according to the available data) and Abstracts Views on Vision4Press platform.
Data correspond to usage on the plateform after 2015. The current usage metrics is available 48-96 hours after online publication and is updated daily on week days.
Initial download of the metrics may take a while.