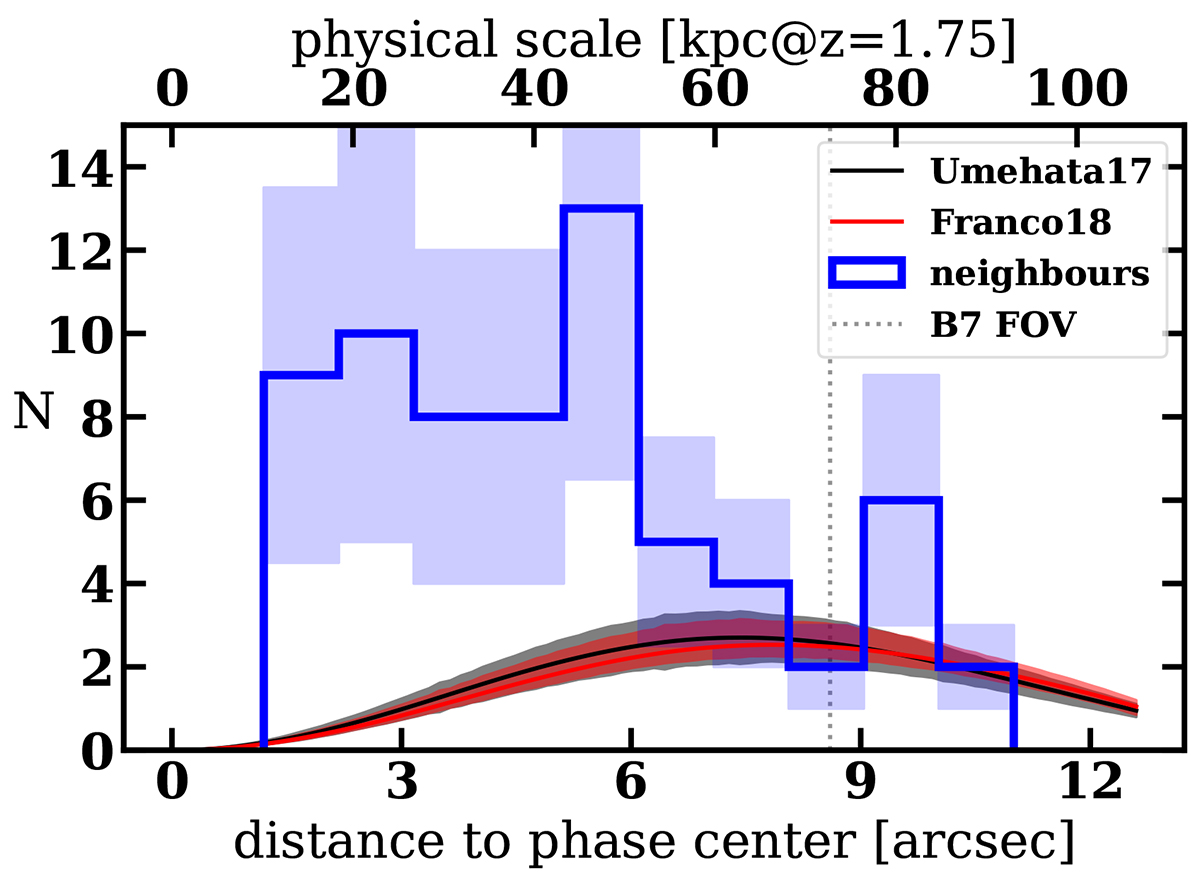
Fig. 8.
Download original image
Comparison between the number of sources detected around the quasar sample at separations > 1″ and S/N > 5 (blue, with Poisson errors indicated as shaded regions) and the expected field source counts from Umehata et al. (2017, black) and Franco et al. (2018, red). Red and grey shaded areas indicate the 1σ confidence regions from 1000 bootstrap realisations, based on parameter uncertainties reported in those works. Counts represent the expected number of unrelated serendipitous sources over a total area corresponding to apertures of increasing radius (x axis), accounting for primary beam attenuation; this explains the drop beyond the 0.5 dilution fraction (dotted line). The top axis shows the projected physical scales at the sample’s median redshift (z = 1.75).
Current usage metrics show cumulative count of Article Views (full-text article views including HTML views, PDF and ePub downloads, according to the available data) and Abstracts Views on Vision4Press platform.
Data correspond to usage on the plateform after 2015. The current usage metrics is available 48-96 hours after online publication and is updated daily on week days.
Initial download of the metrics may take a while.