Fig. 1.
Download original image
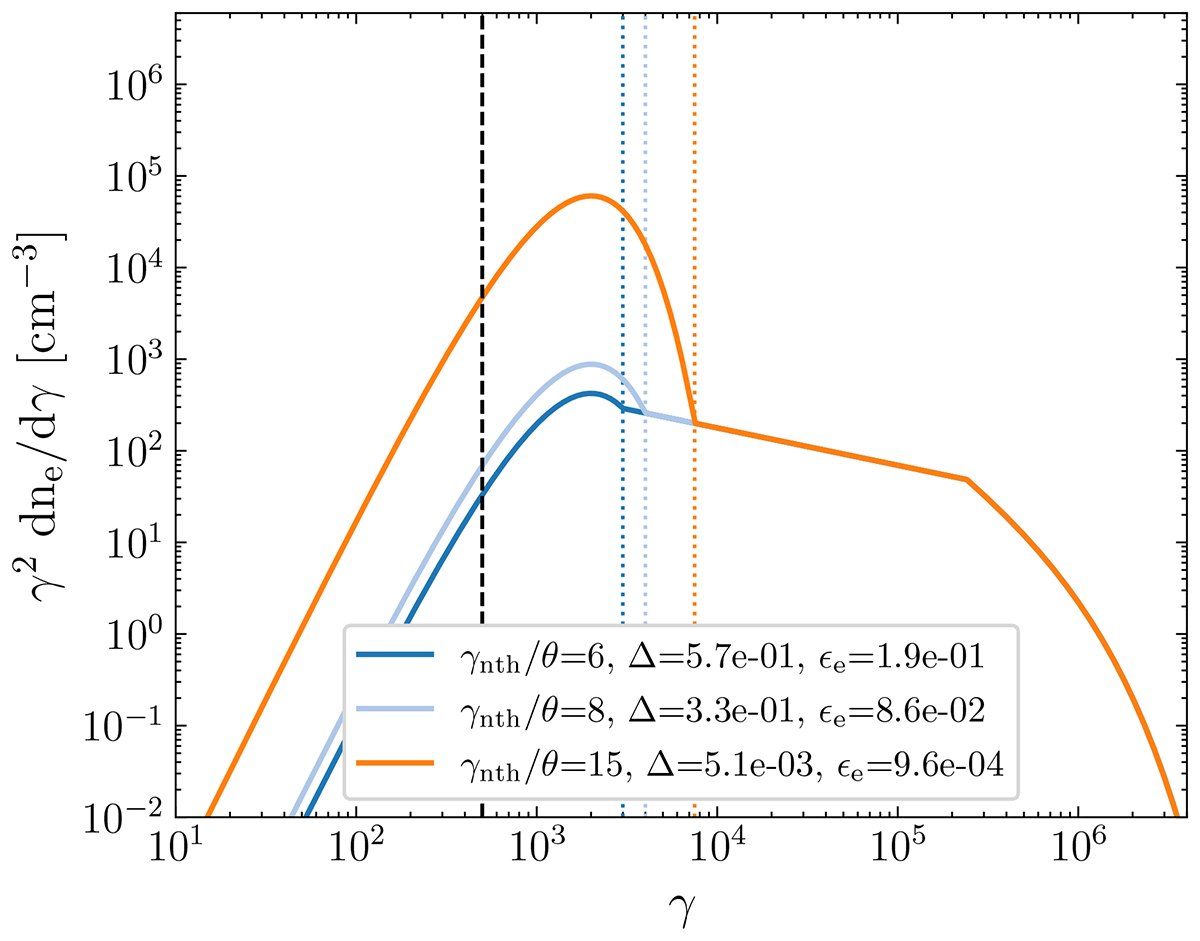
Sample of electron distributions using Eq. (2) for different γnth/θ values ranging from 6 to 15. The dashed black line represents θ, which is fixed to 500. The coloured dotted lines give the location of γnth where the transition from the Maxwellian to the non-thermal component occurs. Here, we arbitrarily set γbr = 2 × 10⁵ and γcut = 7 × 10⁵ and p1 = 2.4.
Current usage metrics show cumulative count of Article Views (full-text article views including HTML views, PDF and ePub downloads, according to the available data) and Abstracts Views on Vision4Press platform.
Data correspond to usage on the plateform after 2015. The current usage metrics is available 48-96 hours after online publication and is updated daily on week days.
Initial download of the metrics may take a while.