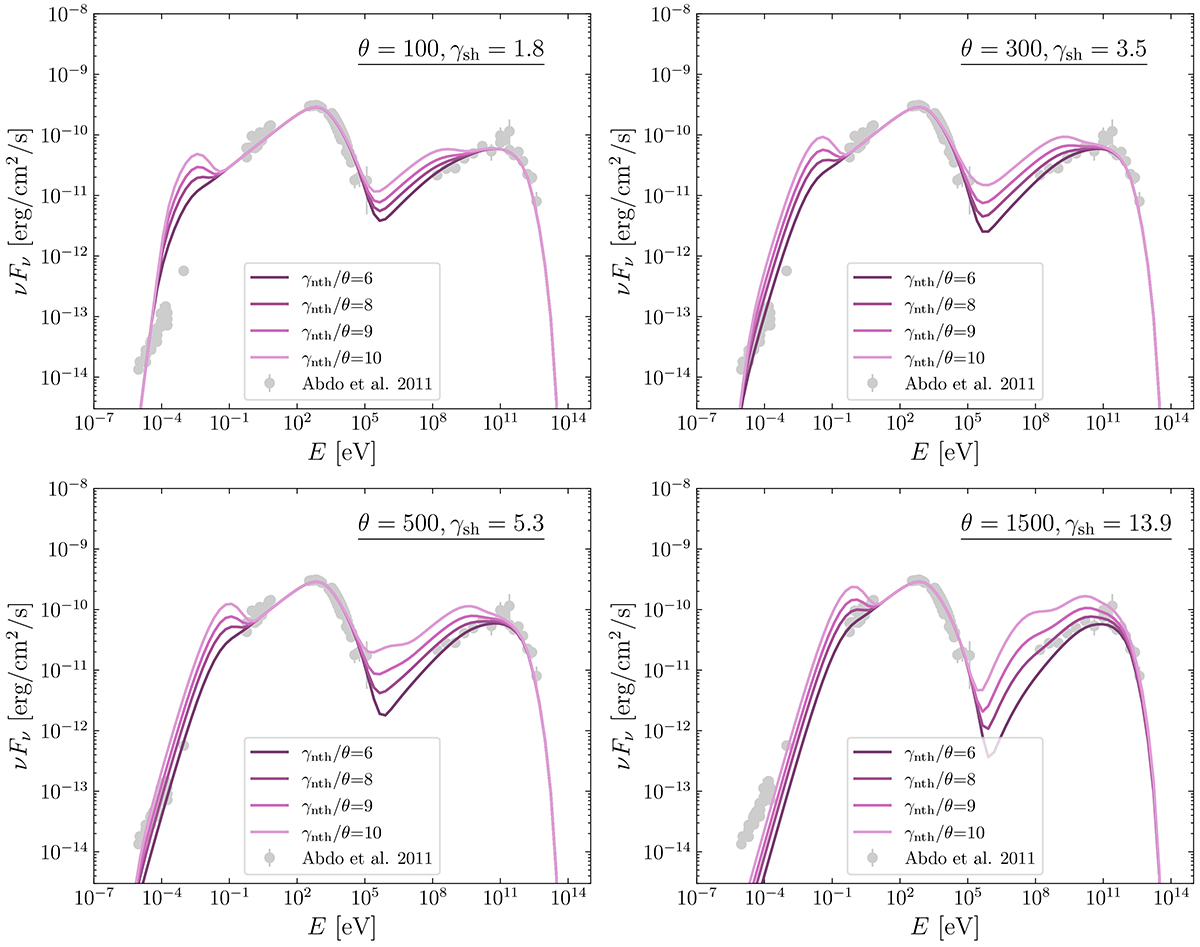
Fig. A.1.
Download original image
SED models for θ = [100, 300, 500, 1500]. Solid lines, from light violet to dark violet, cover three different γnth/θ = [6, 8, 9, 9], i.e. the transition region where the fit degrades. For each θ, the corresponding shock velocity γsh is also given. We refer the reader to Sect. 5 for more details on the connection between θ and γsh. The SED from Abdo et al. (2011) is plotted with grey markers.
Current usage metrics show cumulative count of Article Views (full-text article views including HTML views, PDF and ePub downloads, according to the available data) and Abstracts Views on Vision4Press platform.
Data correspond to usage on the plateform after 2015. The current usage metrics is available 48-96 hours after online publication and is updated daily on week days.
Initial download of the metrics may take a while.