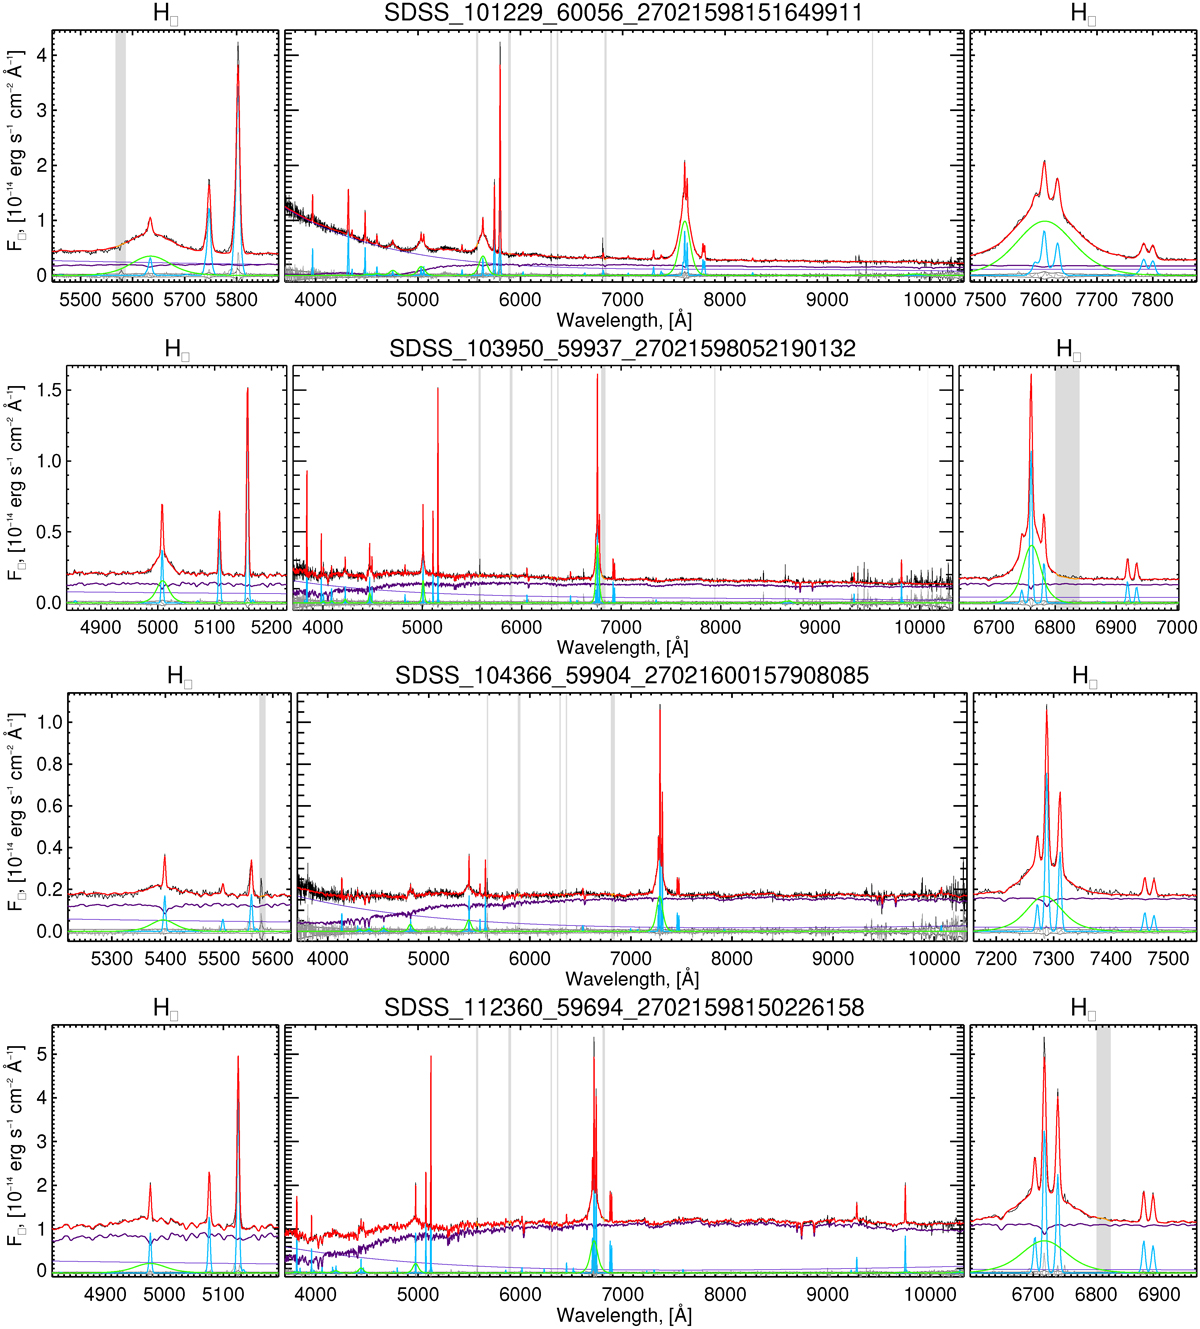
Fig. 3.
Download original image
Some examples of SDSS-V spectra fitted using the NBURSTS full-spectrum fitting technique with E-MILES SSP models and double emission line templates (narrow and broad). Four spectra with a high S/N in continuum (> 20), which allows a reliable identification of the narrow and broad components, were selected for demonstration. The broad-line component is clearly visible and robustly detected in multiple Balmer series lines. This confirms the BLR alongside the NLR. The central panels show the spectrum in the full available wavelengths range, and the side panels show the surrounding ranges of two spectral lines Hβ and Hα. The black line corresponds to spectrum fluxes, the red line shows a best-fit model, the purple line shows a stellar population model including multiplicative continuum (stellar component), the dark blue line shows an additive component that describes the AGN continuum, and the light blue and green lines show emission line templates for narrow and broad lines, respectively. The dark gray line shows the residuals, and the light gray areas show masked regions that were excluded from the fit.
Current usage metrics show cumulative count of Article Views (full-text article views including HTML views, PDF and ePub downloads, according to the available data) and Abstracts Views on Vision4Press platform.
Data correspond to usage on the plateform after 2015. The current usage metrics is available 48-96 hours after online publication and is updated daily on week days.
Initial download of the metrics may take a while.