Fig. 5.
Download original image
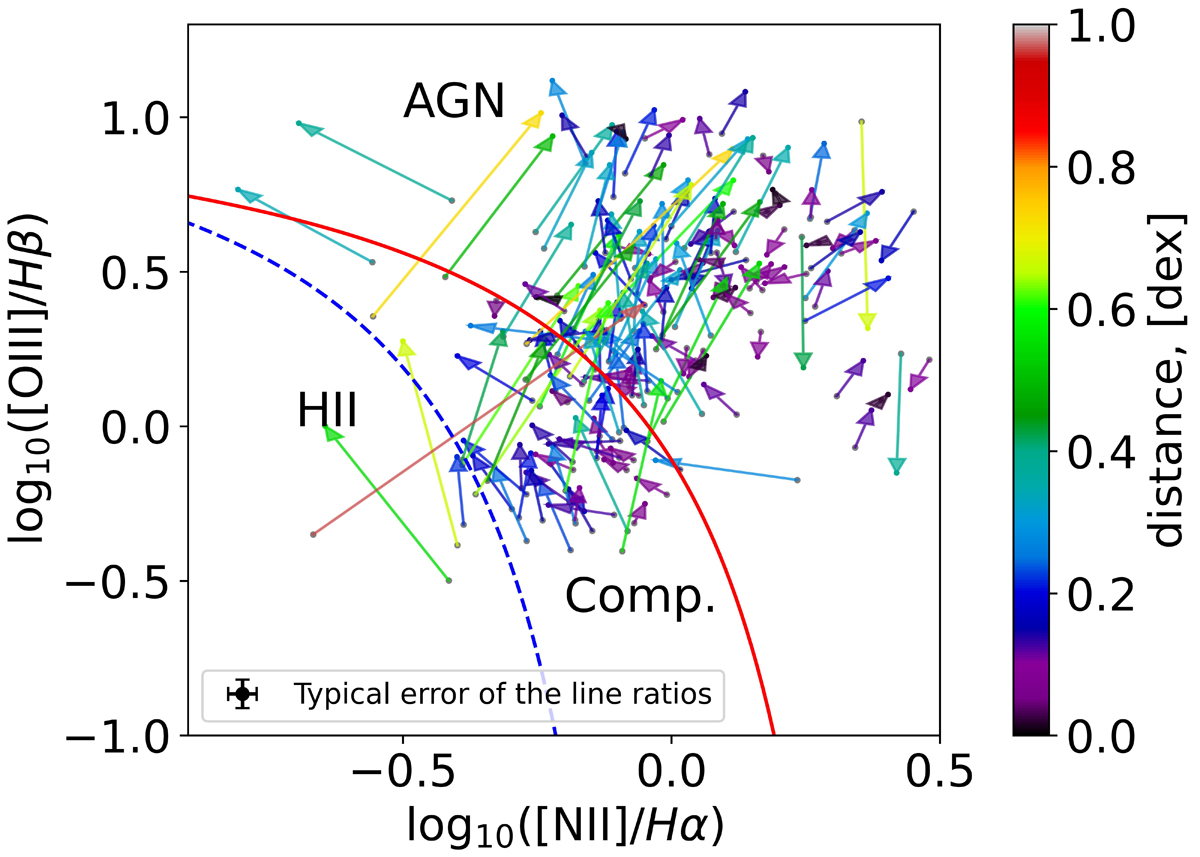
Change in the position in the BPT diagram for 101 galaxies of the matched sample from this work with the RCSED catalog. At the base of the arrow is the position determined by the emission line fluxes from the RCSED without decomposition, and at the top of the arrow is the position determined by the narrow component as a result of decomposition into narrow and broad components. The color code denotes the distance between the two measures in the diagram.
Current usage metrics show cumulative count of Article Views (full-text article views including HTML views, PDF and ePub downloads, according to the available data) and Abstracts Views on Vision4Press platform.
Data correspond to usage on the plateform after 2015. The current usage metrics is available 48-96 hours after online publication and is updated daily on week days.
Initial download of the metrics may take a while.