Open Access
Fig. 6.
Download original image
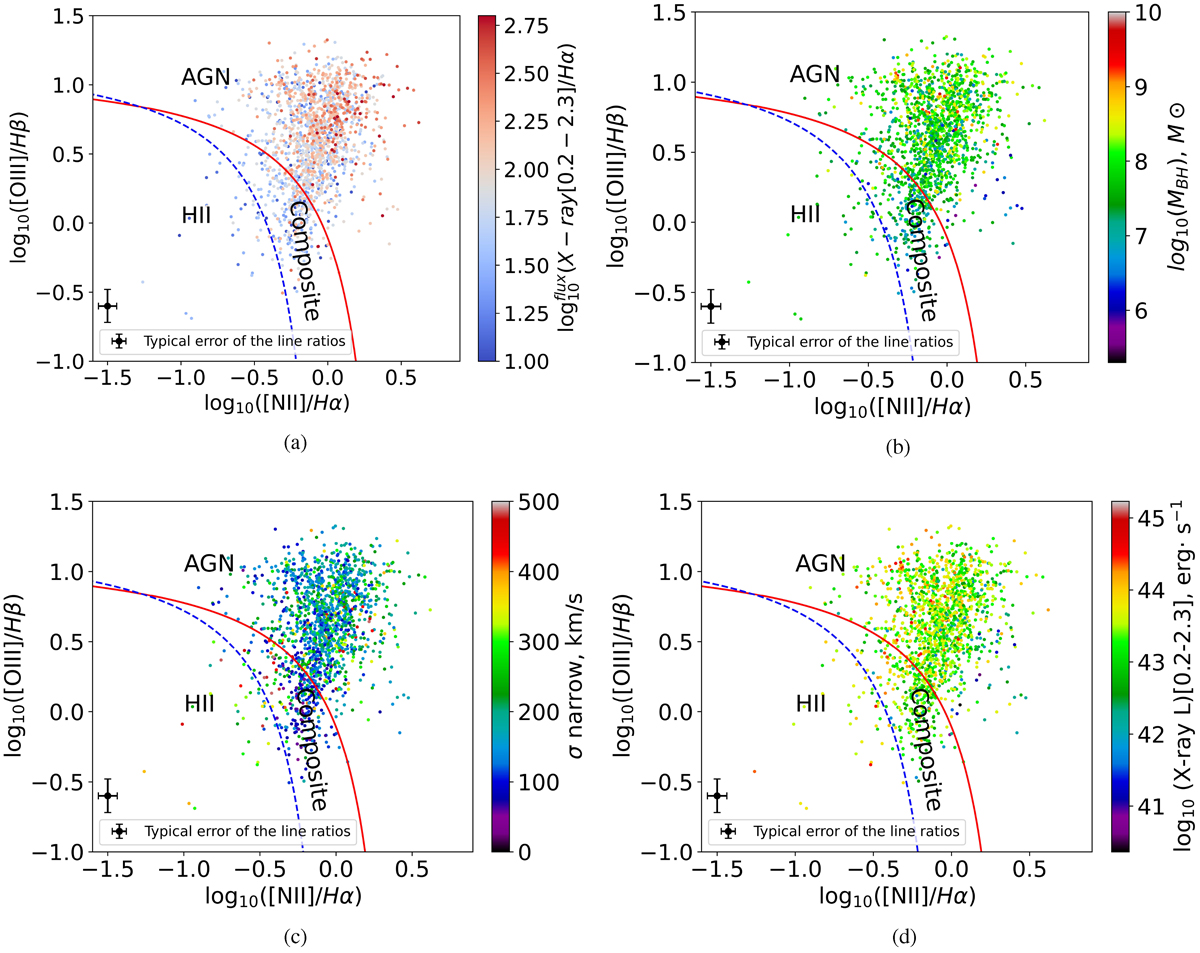
BPT diagram for X-ray-selected galaxies. The color codes show the ratio of X-ray [0.2 − 2.4 keV] to Hα (panel a), the black hole mass (panel b), the σnarrow, km s−1 (panel c), and the X-ray luminosity in 0.2 − 2.3 keV (panel d).
Current usage metrics show cumulative count of Article Views (full-text article views including HTML views, PDF and ePub downloads, according to the available data) and Abstracts Views on Vision4Press platform.
Data correspond to usage on the plateform after 2015. The current usage metrics is available 48-96 hours after online publication and is updated daily on week days.
Initial download of the metrics may take a while.