Fig. 8.
Download original image
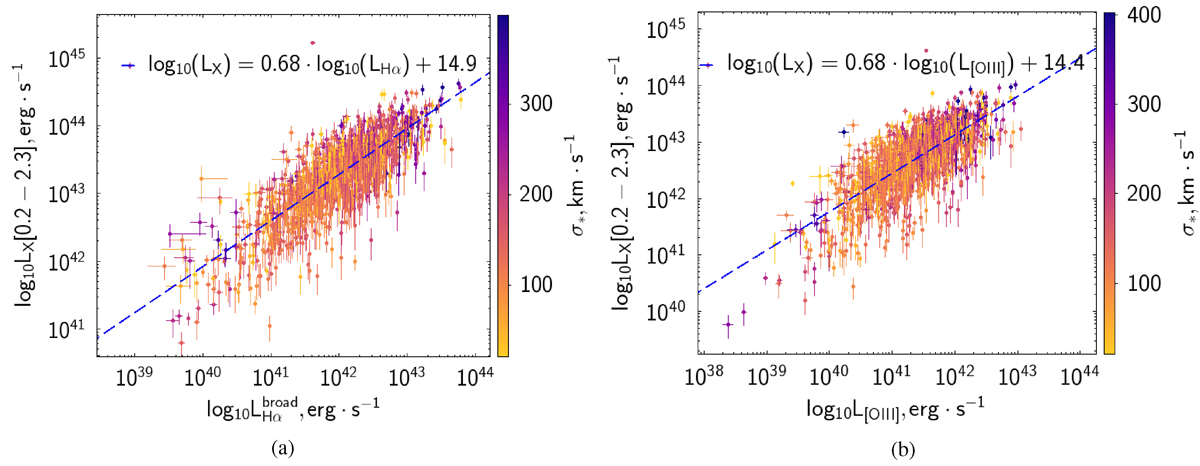
Correlations between the X-ray [0.2 − 2.3 keV], broad Hα (a), and narrow [O III] (b) luminosities. The color-coding represents the velocity dispersion of the stellar component and links the kinematics to the AGN activity. The dashed lines and equations near the top of the panel denote the best-fit correlations. The uniform scaling between the X-ray and line luminosities reinforces their common AGN origin.
Current usage metrics show cumulative count of Article Views (full-text article views including HTML views, PDF and ePub downloads, according to the available data) and Abstracts Views on Vision4Press platform.
Data correspond to usage on the plateform after 2015. The current usage metrics is available 48-96 hours after online publication and is updated daily on week days.
Initial download of the metrics may take a while.