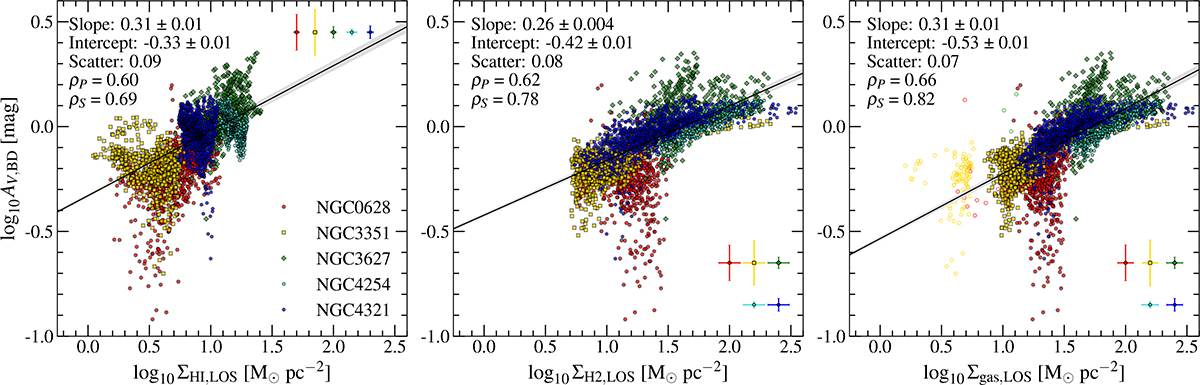
Fig. 5.
Download original image
Attenuation on the V band, derived from the BD, as a function of the line-of-sight surface density of the atomic (left panel), molecular (middle panel) and total gas (right panel) mass. Each galaxy is represented by a different colour. The median uncertainties for each galaxy are shown in the top or the lower right corner of the panels. The solid lines are the best linear fits to the full sample, while a shaded area indicates the fit uncertainty. The slope, intercept, and scatter of each fit are also given along with the correlation coefficients.
Current usage metrics show cumulative count of Article Views (full-text article views including HTML views, PDF and ePub downloads, according to the available data) and Abstracts Views on Vision4Press platform.
Data correspond to usage on the plateform after 2015. The current usage metrics is available 48-96 hours after online publication and is updated daily on week days.
Initial download of the metrics may take a while.