Fig. 6.
Download original image
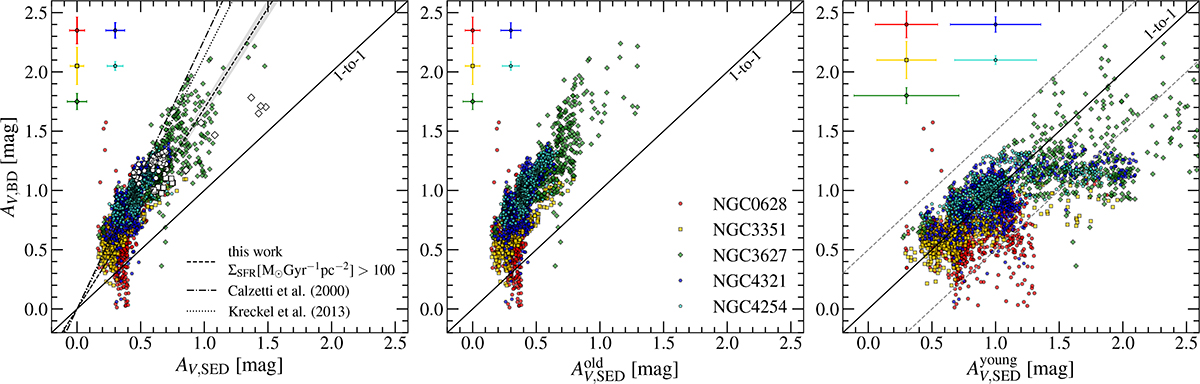
Correlation between the V-band attenuation derived by BD and SED fitting (total, old, and young stars, in the left, middle, and right panels, respectively). Each galaxy is represented by a different colour. A solid line stands for the one-to-one relation. Left panel: AV, BD versus the total attenuation estimated by CIGALE (AV, SED). Points with ΣSFR [![]() ] > 100 are shown in white. The best-linear fit to the latter points, assuming a zero intercept, is plotted with a dashed line and its uncertainty is indicated by the shaded grey area. A dash-dotted and a dotted line represent the corresponding results from Calzetti et al. (2000) and Kreckel et al. (2013). Middle panel: AV, BD versus the attenuation of the old stellar component as estimated by CIGALE (AV, SEDold). Right panel: AV, BD versus the attenuation of the young stellar component as estimated by CIGALE (AV, SEDyoung). The plus-minus 0.5 dex area is defined by the dashed grey lines.
] > 100 are shown in white. The best-linear fit to the latter points, assuming a zero intercept, is plotted with a dashed line and its uncertainty is indicated by the shaded grey area. A dash-dotted and a dotted line represent the corresponding results from Calzetti et al. (2000) and Kreckel et al. (2013). Middle panel: AV, BD versus the attenuation of the old stellar component as estimated by CIGALE (AV, SEDold). Right panel: AV, BD versus the attenuation of the young stellar component as estimated by CIGALE (AV, SEDyoung). The plus-minus 0.5 dex area is defined by the dashed grey lines.
Current usage metrics show cumulative count of Article Views (full-text article views including HTML views, PDF and ePub downloads, according to the available data) and Abstracts Views on Vision4Press platform.
Data correspond to usage on the plateform after 2015. The current usage metrics is available 48-96 hours after online publication and is updated daily on week days.
Initial download of the metrics may take a while.