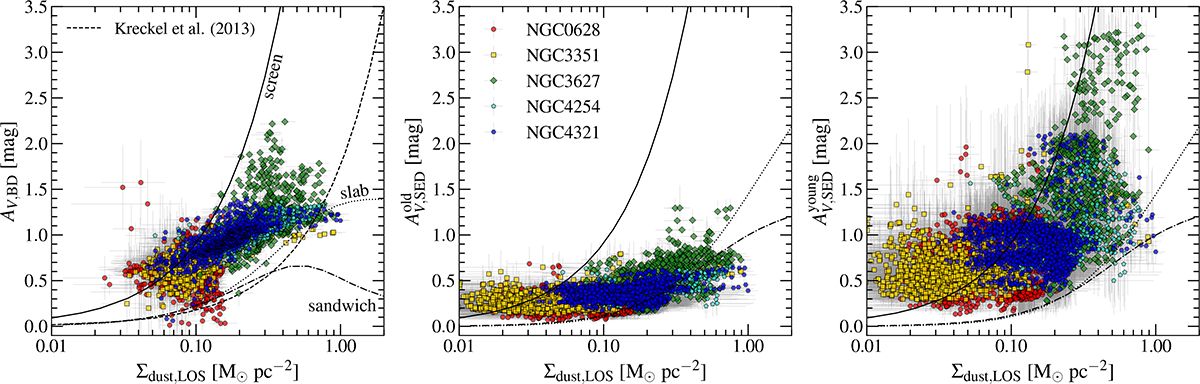
Fig. 7.
Download original image
Relation of line-of-sight dust mass surface density with V-band attenuation derived by the BD (left panel), attenuation of the old stars by the SED fitting (middle panel) and attenuation of the young stars also derived by CIGALE (right panel). Uncertainties in both axes are shown in grey. The dust mass surface density estimated under the assumption of a foreground screen dust model is plotted with a solid line. The dotted and dash-dotted curves show the results of the slab and sandwich models, respectively: those in the left panel are for the AV, BD–Σdust relation, those in the central and right panel for AV–Σdust. The best fit of Kreckel et al. (2013) is plotted with a dashed line in the left panel.
Current usage metrics show cumulative count of Article Views (full-text article views including HTML views, PDF and ePub downloads, according to the available data) and Abstracts Views on Vision4Press platform.
Data correspond to usage on the plateform after 2015. The current usage metrics is available 48-96 hours after online publication and is updated daily on week days.
Initial download of the metrics may take a while.