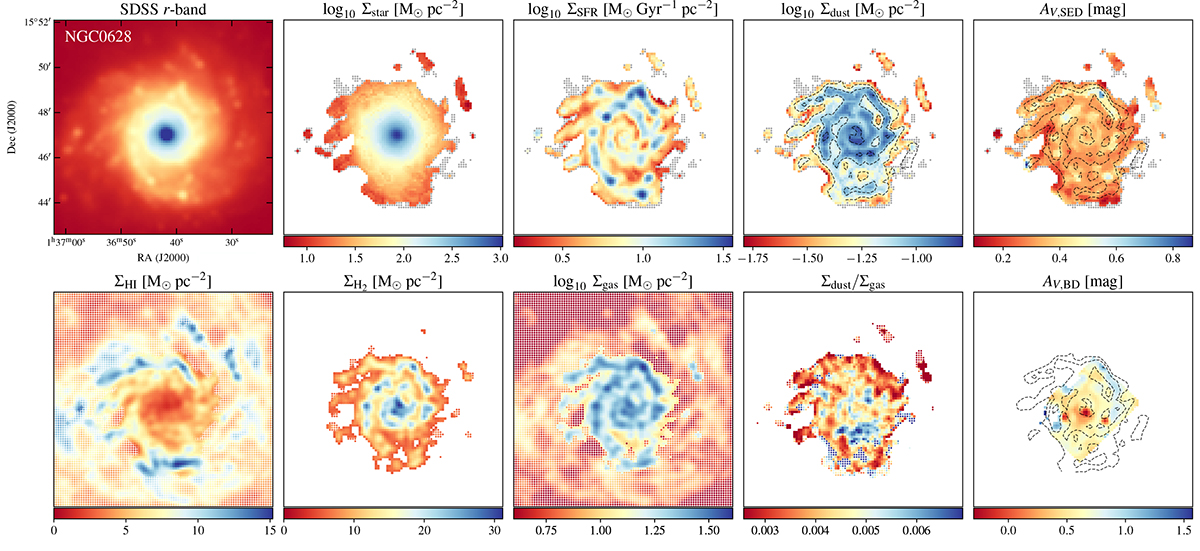
Fig. A.1.
Download original image
Maps of observed and derived properties of NGC 0628. Top: Convolved and re-gridded SDSS r band, log10Σstar, log10ΣSFR, log10Σdust, as well as SED-fitting-derived V-band attenuation (AV, SED), from left to right. Bottom: ΣHI, ΣH2, log10Σgas, DGR and V-band attenuation derived by the BD (AV, BD), from left to right. Grey points correspond to pixels that are rejected (see Sec. 2.1.1, 2.3 for more details). The ΣHI and ΣH2 maps extend up to their corresponding 3σ limit. For ΣHI, ΣH2 and AV, BD maps pixels that correspond to areas excluded by the SED-fitting analysis are plotted with smaller dots. In log10Σgas map, pixels excluded by the SED-fitting analysis and having both H I and CO detection are depicted by smaller squares, while pixels with only H I and not CO are plotted with dots. Contours plotted in some map are from log10Σdust [M⊙ pc−2] maps with a lowest contour at -1.3 and linear spacing with the highest at -0.9. Dots in each map indicate areas excluded fro the SED fitting routine.
Current usage metrics show cumulative count of Article Views (full-text article views including HTML views, PDF and ePub downloads, according to the available data) and Abstracts Views on Vision4Press platform.
Data correspond to usage on the plateform after 2015. The current usage metrics is available 48-96 hours after online publication and is updated daily on week days.
Initial download of the metrics may take a while.