Open Access
Fig. 2.
Download original image
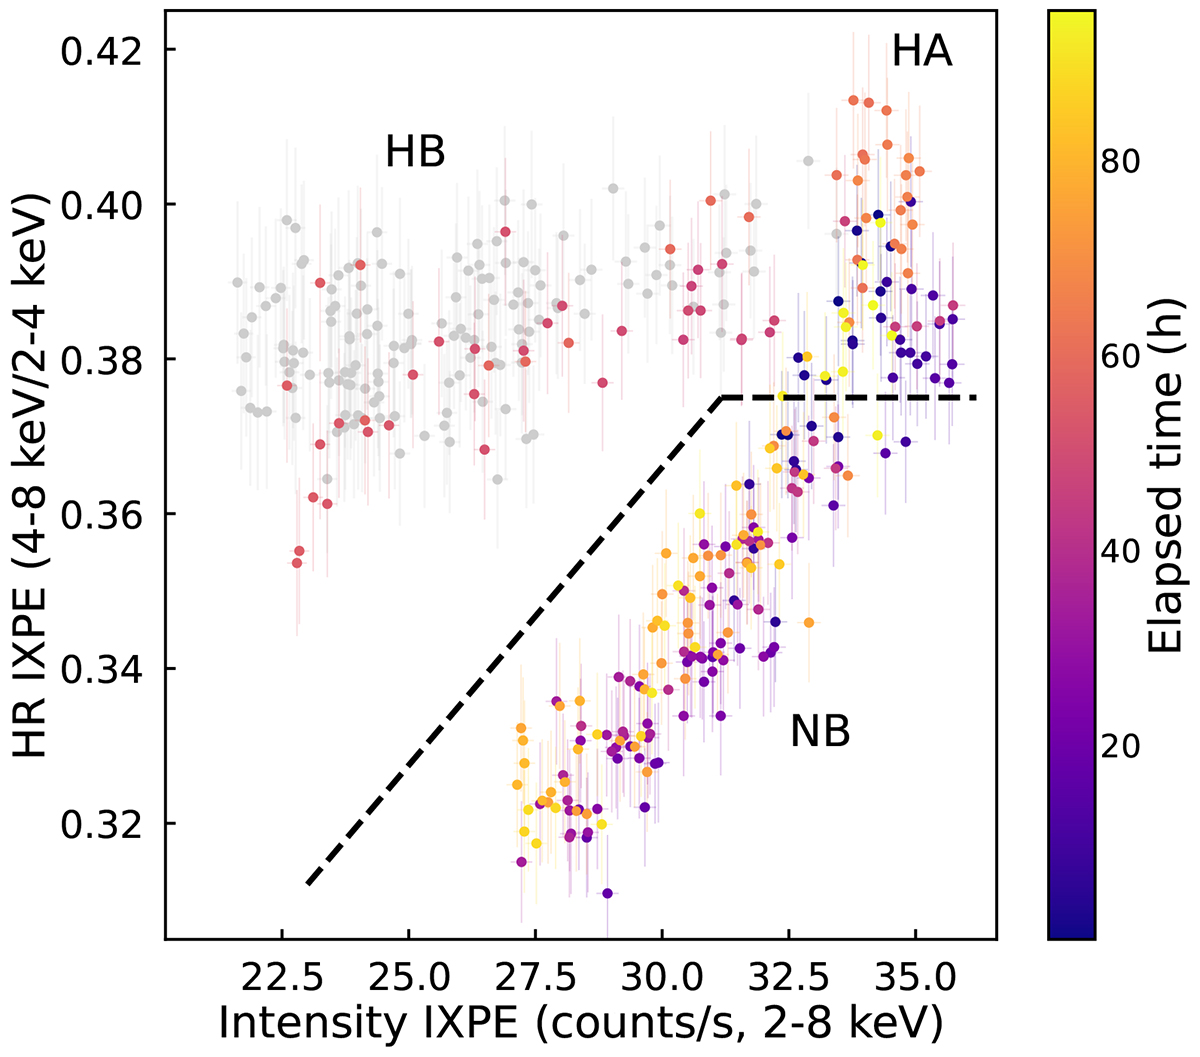
IXPE HID of the second IXPE observation of GX 340+0 in 600 s time bins. The grey points represent the first IXPE observation, while the coloured ones, from dark blue to yellow, report the elapsed time in hours since the start of the second IXPE observation. The dotted black line defines the region we used to select the NB.
Current usage metrics show cumulative count of Article Views (full-text article views including HTML views, PDF and ePub downloads, according to the available data) and Abstracts Views on Vision4Press platform.
Data correspond to usage on the plateform after 2015. The current usage metrics is available 48-96 hours after online publication and is updated daily on week days.
Initial download of the metrics may take a while.