| Issue |
A&A
Volume 702, October 2025
|
|
|---|---|---|
| Article Number | A101 | |
| Number of page(s) | 11 | |
| Section | Astrophysical processes | |
| DOI | https://doi.org/10.1051/0004-6361/202555134 | |
| Published online | 14 October 2025 | |
X-ray spectropolarimetric characterisation of the Z source GX 340+0 in the normal branch
1
INAF–Istituto di Astrofisica e Planetologia Spaziali, Via del Fosso del Cavaliere 100, 00133 Roma, Italy
2
Dipartimento di Fisica, Università degli Studi di Roma “Tor Vergata”, Via della Ricerca Scientifica 1, 00133 Roma, Italy
3
Institute of Space Sciences (ICE, CSIC), Campus UAB, Carrer de Can Magrans s/n, 08193 Barcelona, Spain
4
Institut d’Estudis Espacials de Catalunya (IEEC), 08860 Castelldefels, (Barcelona), Spain
5
INAF–Osservatorio Astronomico di Brera, Via Bianchi 46, 23807 Merate (LC), Italy
6
Department of Physics and Astronomy, 20014 University of Turku, Turku, Finland
7
Department of Physics and Astronomy, Wayne State University, 666 W. Hancock St., 48201 Detroit (MI), USA
8
Guangxi Key Laboratory for Relativistic Astrophysics, School of Physical Science and Technology, Guangxi University, Nanning 530004, China
9
Key Laboratory of Particle Astrophysics, Institute of High Energy Physics, Chinese Academy of Sciences, Beijing 100049, China
10
National Astronomical Observatories, Chinese Academy of Sciences, 20A Datun Road, Beijing 100101, China
11
School of Astronomy and Space Sciences, University of Chinese Academy of Sciences, 19A Yuquan Road, Beijing 100049, China
12
Institute for Frontier in Astronomy and Astrophysics, Beijing Normal University, Beijing 102206, China
⋆ Corresponding author: This email address is being protected from spambots. You need JavaScript enabled to view it.
Received:
11
April
2025
Accepted:
16
August
2025
Abstract
This study presents an X-ray spectropolarimetric characterisation of the Z source GX 340+0 during the normal branch (NB) and compares it with that obtained for the horizontal branch (HB), using IXPE, NICER, and NuSTAR observations. The analysis reveals significant polarisation, with polarisation degrees of ∼1.4% in the NB and ∼3.7% in the HB, indicating a notable decrease in polarisation when transitioning from the HB to the NB. The polarisation angles show a consistent trend across the states. Spectropolarimetric analysis favours a dependence of the polarisation on the energy. The Comptonised component shows similar polarisation in both the HB and NB and is higher than the theoretical expectation for a boundary or spreading layer. This suggests a contribution from the wind or the presence of an extended accretion disc corona (ADC) to enhance the polarisation. The results obtained here highlight the importance of using polarimetric data to better understand the accretion mechanisms and the geometry of this class of sources, providing insights into the nature of the accretion flow and the interplay between different spectral components. Overall, the findings advance our understanding of the physical processes governing accretion in low-mass X-ray binaries.
Key words: accretion / accretion disks / polarization / stars: low-mass / stars: neutron / stars: individual: GX 340+0 / X-rays: binaries
© The Authors 2025
 Open Access article, published by EDP Sciences, under the terms of the Creative Commons Attribution License (https://creativecommons.org/licenses/by/4.0), which permits unrestricted use, distribution, and reproduction in any medium, provided the original work is properly cited.
This article is published in open access under the Subscribe to Open model. This email address is being protected from spambots. You need JavaScript enabled to view it. to support open access publication.
1. Introduction
Low-mass X-ray binaries (LMXBs) that host accreting weakly magnetised neutron stars (WMNSs) are systems in which the donor star, with a mass that is typically smaller than one solar mass, transfers matter to the neutron star (NS) via Roche-lobe overflow, forming an accretion disc. A disc coplanar boundary layer (BL) can form as the accretion flow slows from the high velocity of the disc to the lower velocity at the NS surface (Shakura & Sunyaev 1988; Popham & Sunyaev 2001). Furthermore, accreting matter can spread across the NS surface, forming a spreading layer (SL) that can extend vertically with respect to the disc up to high latitudes on the NS surface (Inogamov & Sunyaev 1999; Suleimanov & Poutanen 2006). The WMNSs are classified, on the basis of the shape they track in the X-ray colour-colour diagram (CCD) and the hardness-intensity diagram (HID) (see, e.g., van der Klis 1989; Hasinger & van der Klis 1989), into Z and Atoll sources. The Z sources, which show luminosities near the Eddington limit, follow a Z shape divided into three distinct branches: horizontal (HB), normal (NB), and flaring (FB); regions connecting the branches are named the hard apex (HA) and the soft apex (SA) (Church et al. 2012; Motta & Fender 2019). These different states correspond to different accretion rates (̇M), which are characterised by the different hardnesses of their spectra: the FB spectrum is softer with higher ̇M, while the HB spectrum is harder with lower ̇M. Atolls are fainter compared to Z sources and display a hard state named Island and a soft state named Banana. For general reviews of WMNSs see, e.g., Done et al. (2007), Bahramian & Degenaar (2023), Di Salvo et al. (2024).
Six persistent Z sources are known so far; traditionally, they are further divided into Sco-like and Cyg-like ones (Kuulkers et al. 1994, 1997). Sco X-1, GX 349+2, and GX 17+2 belong to the first group, while Cyg X-2, GX 5−1, and GX 340+0 belong to the second one. Cyg-like and Sco-like sources have different Z tracks. Cyg-like sources have a full Z track and a weak flaring state, while Sco-like sources have a Z track with an HB that is difficult to spot and a higher-flux flaring state. In addition, Cyg-like sources are supposed to have a higher inclination or a higher magnetic field than Sco-like sources (Psaltis et al. 1995; Kuulkers et al. 1997; Church et al. 2012).
One of the open questions in understanding WMNSs is the geometry of their accretion flow and the mechanism at the basis of it; in particular, the shape of the region between the inner disc and the NS surface and the contributions of each emitting region (BL, SL, inner disc, and NS surface) to their spectra are still a matter of debate (see, e.g., Ludlam 2024, and references therein). X-ray spectra of WMNSs have a continuum in which a soft and a harder component can be identified. The soft one can be described by a multi-colour or single-temperature black body that can be associated with the emission from the inner accretion disc or the NS surface or both of them, while the harder one can be described by a Comptonised continuum that can originate from the BL and/or SL. In addition, the Comptonised medium can also be an optically thin plasma located above and below the disc, named the accretion disc corona (ADC) (see, e.g., White & Holt 1982; Parmar & White 1988; Miller & Stone 2000). A typical feature in the WMNSs spectra is the presence of a fluorescence iron line at ∼6.4 keV; this is the main feature of a reflection spectrum due to the emission of reprocessed radiation by the inner accretion disc. Studying the reflection spectrum gives an insight into the inner region near the NS (see, e.g., Bhattacharyya & Strohmayer 2007; Cackett et al. 2008; Miller et al. 2013; Ludlam et al. 2017, 2022; Ludlam 2024). Spectral properties, supported by timing studies (Gilfanov et al. 2003; Revnivtsev & Gilfanov 2006; Revnivtsev et al. 2013), associate quasi-periodic oscillations with a hard stable component, favouring the presence of a Comptonising medium between the inner disc and the NS surface; thus, these results agree with predictions for BL and/or SL reported in the so-called eastern model scenario (Mitsuda et al. 1984, 1989).
Recently, thanks to the Imaging X-ray Polarimetry Explorer (IXPE; Soffitta et al. 2021; Weisskopf et al. 2022), a new diagnostic tool for studying the geometry and accretion mechanism of WMNSs has become available: X-ray polarisation. It adds two new observables, the polarisation angle (PA) and the polarisation degree (PD), to the existing information obtained by the spectral and timing properties. Since its launch in 2021, IXPE has observed all persistent Z sources, measuring a higher PD in the HB compared to the NB, SA, and FB (see, e.g., Di Marco 2025). Similar values for the PDs of the HB and NB were also measured for the transient XTE J1701−462 (Cocchi et al. 2023), which showed both Z and atoll peculiarities; this source showed hints of variation in the PA with time in the NB (Di Marco 2025; Zhao et al. 2025). Other WMNSs showed variations of the PA with the source state and time, such as Cir X-1 (Rankin et al. 2024) and GX 13+1 (Bobrikova et al. 2024a,b; Di Marco et al. 2025). To study the geometry of WMNSs, it is interesting to correlate the measured PA with the radio jet’s direction, which is almost perpendicular to the disc plane. Unfortunately, the direction of the radio jet was measured only for a few WMNSs (Fomalont et al. 2001a,b; Spencer et al. 2013). IXPE observed a PA aligned with the radio jet for Cyg X-2 (Farinelli et al. 2023), while it measured a PA rotated ∼46° for Sco X-1 (La Monaca et al. 2024a) and a PA not aligned with the radio jet for Cir X-1, where a rotation with time and hardness was reported (Rankin et al. 2024). A review of IXPE results on WMNSs can be found in, for example, Ursini et al. (2024) and Di Marco (2025).
IXPE observed GX 340+0 (4U 1642−45) twice, with the first observation covering the HB (La Monaca et al. 2024b; Bhargava et al. 2024a) and the second covering the NB, as is reported here and in Bhargava et al. (2024b), in which a different approach to the analysis and data interpretation was adopted. For the HB, IXPE reported a highly significant detection of polarisation with PD = 4.3%±0.4% and PA = 36° ±3°. The spectropolarimetric analysis, based on a broadband modelling of the NICER and NuSTAR quasi-simultaneous observations, revealed a significant polarisation for both the soft and the hard components. Notably, their PAs differ ∼40°, even though, based on the geometry and optical depth of the BL and/or SL, they would typically be expected to be nearly parallel or orthogonal (see, e.g., Sunyaev & Titarchuk 1985). This result may be compatible with a misalignment of the NS axis with respect to the accretion disc axis. The same conclusions were obtained for Cir X-1 (Rankin et al. 2024) and GX 13+1 (Bobrikova et al. 2024a). Recently, La Monaca et al. (2024b), Li et al. (2025), and Ludlam et al. (2025) derived the inclination of the source, studying the reflection spectrum with relxillNS (García et al. 2022), obtaining 34–40 deg, in line with the previous results of D’Aì et al. (2009), Cackett et al. (2010), and Miller et al. (2016) and the estimation by radio observation of Fender & Hendry (2000). This inclination is not expected for a Cyg-like source (Kuulkers & van der Klis 1996), and the measured PD for the disc and the Comptonised components from theoretical polarimetric models (Sunyaev & Titarchuk 1985; Loktev et al. 2022; Farinelli et al. 2024; Bobrikova et al. 2025), also favours an inclination of GX 340+0 that is higher than 60°(La Monaca et al. 2024b). Furthermore, for GX 340+0 previous studies in literature have reported evidence of wind (Miller et al. 2016) and of the presence of an ADC (Church et al. 2006; Ludlam et al. 2025).
This paper presents the results of the second IXPE co-ordinated observational campaign, and it is structured as follows. The observations and data reduction are presented in Sect. 2. The polarimetric and spectropolarimetric analyses are presented in Sect. 3. The discussion and conclusion are given in Sect. 4.
2. Observations and data reduction
List of telescopes and/or instruments with the respective observation IDs and the exposure times of each observation.
The X-ray data from IXPE, NICER, and NuSTAR observatories are publicly available in NASA’s High-Energy Astrophysics Science Archive Research Center (HEASARC). The light curves and HID presented in this paper are obtained using STINGRAY (Huppenkothen et al. 2019a,b; Bachetti et al. 2024). For the X-ray observatories, except in cases where it is explicitly written, the data were extracted using standard pipelines and FTOOLS included in HEASoft version 6.34 blueNasa High Energy Astrophysics Science Archive Research Center (Heasarc). Spectral and spectropolarimetric analyses were performed using XSPEC (Arnaud 1996).
2.1. IXPE
IXPE is a NASA-ASI mission launched in 2021; it enabled the X-ray linear polarisation in the band 2–8 keV to be measured for the first time for almost all classes of astrophysical sources. The satellite comprises three identical telescopes. Each telescope consists of a multi-mirror array with a detector unit (DU) that houses a photoelectric polarimeter in the focal plane. For the satellite performance, the description and the working principle of the on-board instrument, see Soffitta et al. (2021), Baldini et al. (2021), Weisskopf et al. (2022), Di Marco et al. (2022b), and references therein.
IXPE observed GX 340+0 for the second time from UTC 07:25 on August 12 2024 to UTC 06:46 on August 16 2024; the IXPE observation ID and the exposure time for each DU are reported in Table 1. We processed the data with the IXPEOBSSIM package version 31.0.3 (Baldini et al. 2022). This software, developed within the IXPE collaboration, allows for model-independent polarimetric analysis using the xpbin tool with the pcube algorithm based on the Kislat et al. (2015) approach. The IXPE data were binned to have a minimum of 30 counts per bin for the Stokes I spectrum, and a constant binning of 200 eV for the Stokes Q and U ones. The IXPE data were analysed using the CALDB response matrices 20240701 released with IXPEOBSSIM on February 28 2024. The source was selected in a 100″ radius circular region centred on the source position using SAOIMAGEDS91 Due to the relatively high flux of the source and following the IXPE prescription reported in Di Marco et al. (2023b), the polarimetric analysis was performed without subtracting the background.
2.2. NICER
The Neutron Star Interior Composition Explorer (NICER) is an X-ray instrument operating on board the International Space Station since 2017. It consists of 56 co-aligned concentrator X-ray optics focusing the X-rays on silicon drift detectors, and it works in the 0.2–12 keV energy band. A detailed description of the instrument can be found in Gendreau et al. (2016).
NICER performed several short observations of GX 340+0 collected in five simultaneous observation IDs during the second IXPE observation reported here. Table 1 shows the NICER observation IDs and their start and stop dates with total exposure times. NICER data were processed with the NICER Data Analysis Software v012a and with the CALDB version XTI20240206. The NICER spectra were extracted with the nicerl3-spec task, applying the NICER-recommended systematic error vector to the data and optimally binned to have at least 30 counts per bin. The background was estimated using the SCORPEON model; both the full model and the file version were used, and the results were compatible; thus, in the final analysis here reported, we used the file version.
2.3. NuSTAR
The Nuclear Spectroscopic Telescope Array (NuSTAR; Harrison et al. 2013) is an X-ray observatory operating in the 3–79 keV energy band. It comprises two identical telescopes (FPMA and FPMB), each coupling a Wolter-I X-ray optics and a CdZnTe pixel detector. During this new IXPE observation of GX 340+0, there were no strictly simultaneous pointings by NuSTAR. Therefore, as is described in Sect. 3, after identifying the source state in a HID with IXPE and NICER, we selected in the NuSTAR archive an observation of GX 340+0 in the same state, reported in Table 1, aiming to obtain a broadband spectral model.
The NuSTAR data were processed with the standard Data Analysis Software (NuSTARDAS) v2.1.2 with the CALDB version 20241015. As is prescribed for bright sources2, we set the statusexpr="STATUS==b0000xxx00xxxx000" keyword in the NuPIPELINE. The source signal was extracted in a circular region with a radius of 120″ at the position of the source, and the background region is selected in an off-centre sourceless circular region with the same radius. The NuSTAR spectra were binned to have at least 30 counts per bin.
2.4. Einstein Probe
The Einstein Probe (EP; Yuan et al. 2022, 2025) is a mission launched in January 2024 and dedicated to time-domain X-ray astronomy. EP features a wide-field X-ray telescope (WXT) that employs innovative lobster-eye micro-pore optics to monitor the soft X-ray sky (0.5–4 keV) over an instantaneous field of view of ≃3600 deg2 (see also Cheng et al. 2025). Complementing this, the follow-up X-ray telescope (FXT), based on a Wolter-I design, enables deeper spectral and timing studies in the 0.3–10 keV band.
EP-WXT covered the position of GX 340+0 three times during our campaign (see Table 1 for details). Starting from the cleaned event files produced by the processing pipeline available within the WXT Data Analysis Software (WXTDAS), the source photons were extracted from a circular region centred on the source position with a radius of 9′ (corresponding to ≃90% of the encircled energy fraction of the instrument’s point spread function). The background region was defined using a circle with the same radius, located nearby. Background-subtracted light curves were extracted in the 0.5–4, 0.5–2, and 2–4 keV energy bands and binned at 600 s.
3. Data analysis and results
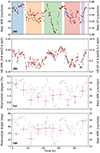 |
Fig. 1. Light curves, HRs, and polarisation properties of GX 340+0 during the second IXPE observation. (a): IXPE light curve binned in 600 s intervals overlapped with the EP-WXT light curve (dodger blue points). The highlighted coloured intervals correspond to the NICER simultaneous observations reported in Table 1 and Fig. 3. (b): IXPE HR binned in 600 s obtained as the ratio of the IXPE counting rates in the 4–8 and 2–4 keV energy bands. (c) and (d): Time-resolved PD and PA in equal time bins of about 9.5 h. The errors are reported at 68% CL, while the upper limits are at 90% CL. |
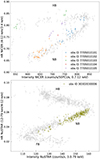 |
Fig. 3. HIDs of GX 340+0 in 150 s time bin. Top panel: HID of GX 340+0 from the NICER data archive (grey points). The coloured points represent the five NICER observations performed during the IXPE one and also reported in Table 1 and Fig. 1-top as shaded coloured regions in the IXPE light curve. Bottom panel: HID of GX 340+0 from the NuSTAR archival data (grey points). The olive green points represent the NuSTAR observation selected to perform the spectral and spectropolarimetric analysis. |
The light curve of this new IXPE observation is reported in Fig. 1a, while Fig. 1b reports the corresponding hardness ratio (HR). The IXPE HR has been obtained as the ratio of the IXPE counting rates in the 4–8 and 2–4 keV energy bands, consistent with the definition adopted by La Monaca et al. (2024b). The light curve shows variations, with a significant drop in flux at about 50 hours since the beginning of the observation. This flux variation corresponds to higher HR values. Figure 1 also reports the light curves and HR from the EP-WXT observations overlaid on those from the IXPE one. Although the short durations of the EP-WXT observations do not allow us to fully track the source state variations, the overall trends in flux and HR are in agreement with those from IXPE during the same time intervals.
To identify the state of the source during this observation and possible state variations, we constructed the IXPE HID, shown in Fig. 2; data points are colour-coded with the elapsed time in hours since the start of the observation. The energy bands we adopted are the same as those used by La Monaca et al. (2024b) for easier comparison with the first IXPE observation, whose points are shown in grey. Comparing the HID from the two observations, we note that at the beginning of this second observation, GX 340+0 was in the HA, then moved to the NB, came back to the HA, moved to the HB (coinciding with a flux decrease in the middle of the observation) and in the last part, moved back to the NB. Thus, this new observation covered mainly the NB, with short excursions into the HB and HA.
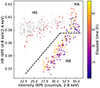 |
Fig. 2. IXPE HID of the second IXPE observation of GX 340+0 in 600 s time bins. The grey points represent the first IXPE observation, while the coloured ones, from dark blue to yellow, report the elapsed time in hours since the start of the second IXPE observation. The dotted black line defines the region we used to select the NB. |
The GX 340+0 state variations are confirmed from the NICER observations performed jointly with the IXPE one, reported in Fig. 3-top. In fact, the NICER HID of the simultaneous observations (coloured points) compared to all the archived NICER observations of GX 340+0 (grey points) shows that GX 340+0 was mainly in NB with short periods in HA and HB. We selected the Observation ID 7705010102 for the spectral analysis.
Unfortunately, no strictly simultaneous NuSTAR observations were available for this second IXPE observation. NuSTAR Observation ID 30901012002 was performed 5 days after this IXPE observation; GX 340+0, during this NuSTAR observation, was in NB, SA, and FB. When selecting only the NB, the exposure time becomes too low, making it preferable to use older observations to obtain a broadband spectral model of the NB. For this purpose, we used archived NuSTAR observations to build the HID reported in Fig. 3-bottom and selected the observation ID 30302030006, which covered GX 340+0 in the NB, to have a suitable observation to use for proper spectral modelling.
3.1. Polarimetric analysis
In this subsection, we report the results obtained by the polarimetric analysis performed using the pcube algorithm in IXPEOBSSIM software (Baldini et al. 2022). Firstly, we investigate possible polarimetric variations with time. Figures 1c and d show PD and PA obtained by dividing the IXPE observation into ten time bins of ∼9.5 h each; the chosen time binning is a trade-off between suitable time resolution and polarimetric sensitivity. The achieved sensitivity does not show any significant variation in PD and PA with either time or source flux, except for possible variations related to the different Z branches (see below).
Given the changes in the source’s state during this observation, with short periods of HA and HB, we focused our analysis on the polarimetric properties in the NB. To separate the period when the source is in the NB from the one in which it is in the HB and HA, we set a threshold on the IXPE intensity and HR (region below the black line of Fig. 2).
The X-ray polarisation measured in the nominal 2–8 keV energy band, after selecting the NB, is PD = 1.4%±0.3% with a PA = 37° ±5° at 68% confidence level (CL). Therefore, we have a detection of polarisation at ∼5.6σ CL, corresponding to a probability of obtaining this polarisation in the case of an unpolarised source of 1.1 × 10⁻⁷.
We performed an energy-resolved analysis of the polarisation of the NB state of GX 340+0, following the same approach reported in La Monaca et al. (2024b) but dividing the nominal IXPE energy band into 1 keV-wide energy bins to enhance the polarimetric significance. The results are shown in Fig. 4 and Table 2, where only an upper limit at 90% CL is reported for the 6–7 keV bin, given its lower significance (1.5σ), while the others show a significance higher than 99% CL.
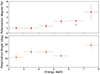 |
Fig. 4. Energy-dependent polarimetric properties of GX 340+0 in the NS. PD (top panel) and PA (bottom panel) as a function of the energy in 1 keV energy bins. The errors are reported at 68% CL, while the upper limit is at 90% CL, see text. |
Energy-resolved polarisation of GX 340+0 in the NB.
We tried to select only HA or HB, or consider both (HA+HB), obtaining PD < 6%, PD < 3%, and PD < 3% at 99% CL, respectively. Thus, while the analysis of the more recent observation yields values compatible with those obtained in La Monaca et al. (2024b), the significance of HB is much lower, mainly due to the shorter exposure time covering GX 340+0 in HB+HA. Combining the new data of this observation in HB with the previous ones, we obtain a marginal improvement in the significance of the polarisation: PD = 3.7%±0.4% with a PA = 36° ±2° (errors are at 68% CL). In Fig. 5, we compare the polarisation in the NB with that obtained for the HB by combining the two observations.
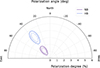 |
Fig. 5. Polarisation in the HB (blue) and in the NB (purple) of GX 340+0. The contours represent the allowed regions at 68%, 90%, and 99% CL. |
It is possible to notice the higher PD in HB with respect to NB, while the PA remains compatible.
3.2. Spectropolarimetric analysis
In La Monaca et al. (2024b), the spectropolarimetric analysis for the HB of GX 340+0 is reported; as was previously stated, this new observation could give just a marginal improvement in the significance of the measured polarisation in HB, which makes a new spectropolarimetric study for this branch not useful. Thus, we performed a spectropolarimetric analysis only for the NB of GX 340+0, to compare if there is any difference between the two branches.
Considering the narrow energy band and the poor spectral resolution of IXPE, we need to constrain our spectral model with a joint NICER + NuSTAR + IXPE broadband spectral analysis. After selecting observations and data, as was previously reported, we performed a joint fit using NICER in (2–12 keV), NuSTAR in (3–30 keV), and IXPE (2–8 keV). The same approach has been adopted in previous papers for this class of sources (see, e.g., La Monaca et al. 2024b). To take into account instrumental effects, we kept the gain free to vary in the fit and added to the NICER spectral model a line at 1.74 keV and an edge at 1.84 keV. Although below our NICER energy threshold, the tail of these features also has an impact above 2 keV.
To model the continuum with XSPEC, for the interstellar absorption model tbabs we set the element abundances at the wilm values (Wilms et al. 2000), and we used the diskbb model for the soft spectral component representing the accretion disc and a Comptonisation model comptt for the harder one associated with the BL and/or SL. We also tested other possible models for the Comptonisation, with different seed photons, but no improvement in reduced χ2 is observed; thus, we used comptt coherently with the fit used in HB by La Monaca et al. (2024b). The comptt model was used as in La Monaca et al. (2024b), assuming the redshift parameter at 0 because GX 340+0 is a galactic source, and the approx at 1, meaning a Comptonising medium such as a slab (similarly to a BL); we also tested the scenario with a spherical Comptonising medium, such as SL or a vertically extended BL, but we found no improvement in the χ2 and also the other parameters in the continuum are almost the same, with the exception of τsphere ∼ 2τslab, as has also been reported in the literature (Farinelli et al. 2023). An excess in the residuals at ∼6.7 keV is observed with respect to the continuum; this is associated with the iron fluorescence line due to reflection from the inner disc. To compensate for this excess, we added a Gaussian to the model, noted as Model A: tbabs*(diskbb+comptt+gauss). Adding the Gaussian line produces an improvement in the χ2/d.o.f. passing from 2735/1693 to 1793/1690. A cross-normalisation constant is included for each detector and/or telescope. The best-fit parameters for Model A are reported in Table 3. In the following, errors are reported at 90% CL if not stated otherwise. The spectral energy distribution with residuals is shown in Fig. 6. The cross calibration gives a gain slope of ∼0.96 keV−1, ∼1.00 keV−1 and ∼0.99 keV−1 for NICER, NuSTAR, and IXPE, respectively; while the gain offsets are ∼80 eV, ∼90 eV, and ∼20 eV. Those values show no strong variation when the different adopted spectral models are applied.
Best-fit parameters of the broadband joint spectral analysis for GX 340+0 in the NB obtained by NICER, NuSTAR, and IXPE.
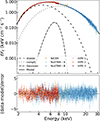 |
Fig. 6. Spectral energy distribution of GX 340+0 in EFE representation for the simultaneous fit using Model A of NICER (dark yellow points), IXPE (red points), and NuSTAR (blue points) observations. The different spectral model components are reported in black lines for diskbb (dashed), bbodyrad (dotted), and Gaussian (dash-dotted). The bottom panel shows the residuals between the data and the best-fit Model A. The best-fit parameters are reported in Table 3. |
To better model the reflection component, we used the relxillNS model (García et al. 2022) instead of the Gaussian; this model is hereafter referred to as Model B: tbabs*(diskbb+comptt+relxillNS). In this case, we froze the density parameter, log N, at its maximum allowed value (García et al. 2022); the NS spin at 0 (Galloway et al. 2008; Miller & Miller 2015; Ludlam 2024), the outer radius at 1000 Rg; and the reflection fraction parameter at −1 to select only the reflection spectral component. We assumed the same temperature for the continuum blackbody in the relxillNS model and in the comptt seed photons; the assumption corresponds to an illumination originating from the BL and/or SL. The inner and outer emissivity indices were assumed to be equal, with the break radius not used. The best-fit values and errors were obtained from a Markov chain Monte Carlo (MCMC) with 100 walkers, a burn-in of 2 × 10⁵, and a chain length of 4 × 10⁵, obtaining the values reported in Table 3. The spectral energy distribution with residuals is shown in Fig. 7. The accretion column density is in line with the expected values for the interstellar medium absorption. The emissivity index is smaller than the one fixed in La Monaca et al. (2024b) and Li et al. (2025), but the value is in agreement with the one obtained by Ludlam et al. (2025). The inner radius is slightly truncated but slightly smaller than the inferred one in HB by La Monaca et al. (2024b).
Spectropolarimetric analysis for both Model A and Model B was performed using weighted spectra (Di Marco et al. 2022a) in XSPEC. Firstly, we fitted only the IXPE Stokes I data with the model parameters frozen to the broadband best-fit parameters of Model A, obtaining a χ2/d.o.f. = 442/444 = 1.0. Then, we performed spectropolarimetric analyses of the I, Q, and U spectra to find a possible dependence of the polarisation with the energy. We started applying the polconst model, which assumes a constant polarisation with the energy, to Model A, in the IXPE energy band. The results are reported in Table 4 and are compatible with the one obtained with the pcube model-independent analysis reported in Table 2 in the 2–8 keV energy band. Subsequently, we applied the pollin model, which assumes a polarisation that varies linearly with energy, and the polpow model, which assumes a polarisation that varies as a power law with energy. In both scenarios, we assumed a constant PA. The results of these different polarimetric models are reported in Table 4. The F-test between the pollin and polconst models gives F = 2.7, corresponding to a probability of improvement of 96%, showing a preference for the pollin model compared to polconst. A similar indication is obtained by Akaike’s information criterion, which gives 772 for polconst and 767 for pollin, with a difference of 5 corresponding to a ’meaningful’ improvement. The polpow model gives the same results of pollin with a negative Aindex, corresponding to increased PD with energy. This analysis confirms the presence of energy variability, even if we cannot disentangle between pollin and polpow, as is reported in Table 2 and Figure 4 from the model-independent pcube analysis.
Weighted spectropolarimetric analysis of GX 340+0 in the NB in the 2–8 keV using Model A combined with different polarisation models: polconst, pollin, and polpow.
Considering that soft and hard components are expected to have different polarisations, we also performed a weighted spectropolarimetric analysis associating the polarisation with each spectral component. It is worth noting that fluorescence emission processes, such as the Gaussian line, are expected to be almost unpolarised (see, e.g., Churazov et al. 2002; Ingram et al. 2023; Veledina et al. 2024), while the reflection continuum is expected to be highly polarised (Matt 1993; Poutanen et al. 1996). Thus, in Model A, we prescribed polarisation to the disc and the Comptonised components, associating a constant polarisation, polconst, with each spectral component and keeping the Gaussian line unpolarised. This approach gives rise to χ2/d.o.f. = 759/734 = 1.03 and the results reported in Fig. 8 and Table 5.
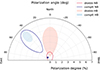 |
Fig. 8. Polar plot with the results of the spectropolarimetric analysis for GX 340+0 in the NB and in the HB: a polconst component is associated with the diskbb and comptt components separately, without any prior constraints on the PA. The contours represent the allowed regions at 90% CL. The colour-shaded contours for the HB are from La Monaca et al. (2024b). The dark blue star represents the maximum polarisation expected by a SL (Bobrikova et al. 2025); see Sect. 4. |
To assess the polarisation of the reflection, we also need to model its continuum, as was done in Model B. Using this model, we associated a constant polarisation with each spectral component, obtaining a χ2/d.o.f. = 769/732 = 1.05, and only an upper limit for the polarisation associated with each of the three spectral components at 90% CL: PD < 1% for the diskbb, PD < 8% for comptt, and PD < 71% for relxillNS. In order to constrain the polarisation of the reflection, we assumed that the polarisation of the disc is 0.7%, as is expected when the inclination is 35° (Chandrasekhar 1960; Sobolev 1963; Loktev et al. 2022) and the polarisation of the Comptonised component is at the value obtained in Table 5 for NB, obtaining an upper limit PD < 26% for relxillNS. Fixing the Comptonised PD to < 0.6% – the maximum expected value, assuming the Comptonised emission from an optically thick and relatively narrow SL and using the parameters of the Comptonising medium reported in Table 3, namely i = 34° and kT = 2.94 keV (Bobrikova et al. 2025) – we derived for the reflection component  and
and  degr.
degr.
4. Discussion and conclusions
GX 340+0 was observed by IXPE twice. In the first observation, the source was in the HB (La Monaca et al. 2024b; Bhargava et al. 2024a), and a PD of ∼4% was detected at high significance. In the second observation, reported here, the source moved between NB and HB, passing through the HA (see Figs. 2 and 3). This variability is confirmed by the IXPE light curve and HR (see Fig. 1a,b) and by the simultaneous EP-WXT and NICER observations. The period in which GX 340+0 is in the HB corresponds roughly to the middle of the observation (see also Bhargava et al. 2024b, where the same observation is studied).
The results obtained from the model-independent polarimetric analysis performed in 2–8 keV with the ixpeobssim package for the HB and the NB of GX 340+0 are reported in Fig. 5. Combining the new data during the HB with those already available, we obtain a marginal improvement in the significance of the detection of polarisation for the HB: PD = 3.7%±0.4% with PA = 36° ±2° at 68% CL. When only NB is selected, we obtain the polarisation measurement for this state to be: PD = 1.4%±0.3% with PA = 37° ±5° at 68% CL. The result is in agreement with the one reported by Bhargava et al. (2024b). Therefore, we observed a significant decrease in polarisation between the HB and the NB, as has been observed in other Z sources, and with PD values for each of the two branches in agreement with values measured in the same branch in other Z sources (see, e.g. Di Marco et al. 2025, for a review). In fact, IXPE measured a polarisation of 1.8%±0.3% with a PA of 140°±4° for Cyg X-2 in the NB (Farinelli et al. 2023), PD = 1.8%±0.4% with a PA = 9° ±2° in the NB+FB of GX 5−1 (Fabiani et al. 2024), and an upper limit of 1.5% at 99% CL for the PD in the NB of XTE J1701−462. Moreover, while the average PD decreases when the source changes state, the average PA remains consistent between NB and HB in all of them, including this new study for GX 340+0.
We also performed a time-resolved study of the polarisation, dividing the second observation into ten equal time bins of about 9.5 h each (see Fig. 1c,d). This study shows a marginal indication of time variability at the beginning of the observation, consistent with the transition from HB to NB, but no evidence of variability during the flux drop. This is probably due to a lack of significance in the analysis and to the mixing of data from NB and HB when dividing the observation into equally spaced time bins, while the selection in the HID (see Fig. 2) allows for a better separation of the HB and the NB data, which show different polarisation. Moreover, no variation in the PA is observed during the NB, in contrast to the case of XTE J1701−462 that showed variations of the PA at 90% CL in the NB (Di Marco 2025; Zhao et al. 2025). An energy-resolved polarisation study reported in Fig. 4 shows an overall trend for PD similar to that observed for HB (La Monaca et al. 2024b; Bhargava et al. 2024a), even if the maximum PD reached with energy is lower: PD = 4.0%±1.5% in the 7.0–8.0 keV of the NB, compared to PD = 12%±3% in the 7.5–8.0 keV of the HB (La Monaca et al. 2024b). On the other hand, the PA in the NB does not show any rotation with the energy, unlike the HB, in which a variation of ∼40° is observed between the soft and high energy bins (La Monaca et al. 2024b). A similar trend with energy was also reported for the Sco-like source GX 349+2 (La Monaca et al. 2025). Moreover, an increase in the PD with energy was observed for some atoll sources, such as 4U 1820−303 (Di Marco et al. 2023a) and GX 9+1 (Prakash et al. 2025).
Combining the simultaneous observations by IXPE and NICER with a non-simultaneous observation by NuSTAR in the NB (see Table 1 and Fig. 3), we performed a broadband spectral analysis, following the same approach as in La Monaca et al. (2024b). We used a simplified model consisting of a diskbb component for the soft emission, comptt for the hard Comptonised emission, and a Gaussian line to describe the main feature of the reflection component. This model provided an acceptable reduced χ2 (see Model A in Table 3 and Fig. 6). The fit shows a spectrum dominated by the soft disc component with a relative flux of ∼63% of the total flux, while the Comptonised component has a relative flux of ∼35%, and the Gaussian line is ∼2% of the total. This is in contrast to the case of HB, where the spectrum was dominated by the Comptonised component (∼78% of the total flux), while the soft component only contributed ∼21% (La Monaca et al. 2024b). Firstly, we performed a spectropolarimetric analysis, fixing the best-fit model for the Stokes I spectrum to the values reported for Model A in Table 3, and applying a constant polarisation to it in the 2–8 keV energy band, obtaining results consistent with those derived by model-independent analysis in the same energy band; see Table 2 and 4. We also tested polarisation models that are not constant with energy, finding that the pollin and polpow models are equally favoured with respect to polconst with a probability of 96%, which confirms a dependence of polarisation on energy. Both polarimetric models report that PD grows in energy, while PA is constant with energy. No evidence of a PA 90° swap, corresponding to a change in the PD sign, is observed either. This energy dependence was also shown by model-independent analysis and has already been observed in the HB. In fact, applying the pollin model to the HB data reported in La Monaca et al. (2024b) we obtained: A1 = (1.9 ± 1.3)%, Aslope = (0.6 ± 0.4)% keV−1, ψ1 = 21° ±10°, and ψslope = (4 ± 3)° keV−1 with χ2/d.o.f. = 1230/1335 = 0.9. Although the polarisation in HB and NB has a similar slope and the PA in HB seems to have a not-zero slope, the higher average polarisation is due to the fact that at A1 is higher in HB than in NB, confirming the indication in Figure 8 of a soft component with higher polarisation in HB than in NB; further observations with a higher significance could be useful in the future to confirm these results.
Consequently, we performed a spectropolarimetric analysis to disentangle the polarisation properties of each spectral component. We assumed the Gaussian to be unpolarised (see Sect. 3.2) and associated a polconst model with both the soft and the Comptonised components, obtaining the results reported in Table 5. Fig. 8 shows this result in the polar plane of PD and PA, in which we also report the results for the spectropolarimetric analysis of HB as in La Monaca et al. (2024b): PD = 3.1%±1.7% with a PA = −1° ±16° for the diskbb and PD = 5.2%±1.0% with a PA = 44° ±5° for comptt. Therefore, during changes in the source state, that is, when passing from HB to NB, the PD of the Comptonised component remains compatible at a confidence level higher than 90% CL without any significant variation in the PA, while the PD of the soft component (even if marginally in agreement with the value in the HB) drops below 1.2% and the PA becomes unconstrained at 90% CL. This means that the average PD decreases in the NB with respect to the HB because the flux in the soft component, which is less polarised, is higher than in the HB. Similar results were reported for the Comptonised component of GX 5−1 in which a PD at a level of ∼4 − 5% was obtained in the HB and in the NB+FB with compatible values for the PA (Fabiani et al. 2024).
In addition, we adopted a complete reflection model, relxillNS, to properly describe this spectral component, as is reported for the HB in La Monaca et al. (2024b). We obtained the best-fit parameters reported as Model B in Table 3 and Fig. 7. As has already been reported for the HB (La Monaca et al. 2024b), also in the case of the NB, it is not possible to disentangle the polarisation of the different spectral components of Model B. To determine the polarisation for the reflection component, we must make assumptions about the polarisation of the soft and hard spectral components. Assuming for the disc component a polarisation at 0.7%, as is expected by Chandrasekhar (1960), for the inclination of ∼35°, with null polarisation for the Comptonised component, gives rise to polarisation for the reflection component, which reaches unphysical values of up to 80% (Matt 1993; Poutanen et al. 1996). If we increase the PD of the Comptonised component, the reflection component shows a much lower polarisation, and to obtain values of ∼20 − 30%, the Comptonised component needs to have PD> 1%.
Even if spectropolarimetric analysis shows that the PA of the disc component is not constrained at a 90% CL, the marginal indication is that its PA is aligned with the one previously measured in HB, which is not orthogonal to that of the Comptonised component. This result is in contrast with theoretical expectations (see, e.g., Sunyaev & Titarchuk 1985; Tomaru et al. 2024) for an optically thick Comptonising medium and it is possibly due to a misalignment between the disc and BL axis and the NS axis (Bobrikova et al. 2024a; Rankin et al. 2024; La Monaca et al. 2024b). The of the disc component is expected to be < 0.7% when the inclination is 35° (Chandrasekhar 1960; Sobolev 1963; Loktev et al. 2022), which is compatible with our results. In fact, the reflection model allows us to obtain an inclination of ∼34° that is compatible with recent results reported in La Monaca et al. (2024b) and Li et al. (2025), but also with previous results reported in the literature (D’Aì et al. 2009; Cackett et al. 2010; Miller et al. 2016).
The PD of the Comptonised component remains constant at PD ∼ 4% between the HB and the NB. If we assume that the Comptonised emission comes from an optically thick and relatively narrow SL, we can get an upper limit on the PD of the harder component. Taking into account the parameters of the Comptonising medium of Tab. 3, namely i = 34° and kT = 2.94 KeV, we expect a PD of < 0.6% Bobrikova et al. (2025) (see Fig. 8). X-rays from such an SL are expected to be polarised along the NS rotation axis. If the SL is wider than we assume, it could only decrease PD, and the PA would remain unchanged Bobrikova25. Other theoretical studies also provide a relatively low expected PD: < 2% for an optically thick BL and/or SL (Sunyaev & Titarchuk 1985; Farinelli et al. 2024). We conclude that the BL and/or SL alone cannot explain the observed PD, which is significantly higher than predicted. One possible explanation for this high polarisation could be the scattering in the wind (Nitindala et al. 2025). We note that such an explanation agrees with the results for GX 340+0 from Miller et al. (2016) in which the presence of wind is claimed, although this feature is not observed in the recent XRISM observation (Ludlam et al. 2025). An alternative explanation for the observed higher polarisation is the presence of an ADC (Church et al. 2006), which may contribute as an additional component of polarised emission (Di Marco et al. 2025). The ADC scenario also agrees with recent results reported in Ludlam et al. (2025).
This new observation and the previous ones from other WMNSs are helping us to better characterise the polarimetric properties of the accretion flow and the geometry of the emission regions in these systems. A general picture is emerging: the hard state (HB) appears to be highly polarised (Cocchi et al. 2023; Fabiani et al. 2024; La Monaca et al. 2024b; Di Marco 2025) and probably dominated by emission from an extended corona or wind, whereas the softer states (NB and FB) are probably dominated by disc and BL emissions (Rankin et al. 2024). In the future, the development of new models and the improved statistics achievable by observing the same sources again for a longer time will help to further unveil the points that at present remain unanswered.
Acknowledgments
This work is supported by National Key R&D Program of China (grant No. 2023YFE0117200), and National Natural Science Foundation of China (grant No. 12373041 and No. 12422306), and Bagui Scholars Program (XF). This research used data products provided by the IXPE Team (MSFC, SSDC, INAF, and INFN) and distributed with additional software tools by the High-Energy Astrophysics Science Archive Research Center (HEASARC), at NASA Goddard Space Flight Center (GSFC). The Imaging X-ray Polarimetry Explorer (IXPE) is a joint US and Italian mission. This work is based on data obtained with the Einstein Probe, a space mission supported by the Strategic Priority Program on Space Science of the Chinese Academy of Sciences, in collaboration with ESA, MPE and CNES (Grant No. XDA15310000, No. XDA15052100). The authors acknowledge the NICER and NuSTAR team whose data were used in this research. The Italian contribution is supported by the Italian Space Agency (Agenzia Spaziale Italiana, ASI) through contract ASI-OHBI-2022-13-I.0, agreements ASI-INAF-2022-19-HH.0 and ASI-INFN-2017.13-H0, and its Space Science Data Center (SSDC) with agreements ASI-INAF-2022-14-HH.0 and ASI-INFN 2021-43-HH.0, and by the Istituto Nazionale di Astrofisica (INAF) and the Istituto Nazionale di Fisica Nucleare (INFN) in Italy. FLM and ADM are partially supported by MAECI with grant CN24GR08 “GRBAXP: Guangxi-Rome Bilateral Agreement for X-ray Polarimetry in Astrophysics”. AB is supported by the Finnish Cultural Foundation grant No. 00240328. RML and SL acknowledge support by NASA under grant No. 80NSSC23K0498.
References
- Arnaud, K. A. 1996, ASP Conf. Ser., 101, 17 [Google Scholar]
- Bachetti, M., Huppenkothen, D., Khan, U., et al. 2024, https://doi.org/10.5281/zenodo.11383212 [Google Scholar]
- Bahramian, A., & Degenaar, N. 2023, in Handbook of X-ray and Gamma-ray Astrophysics, eds. C. Bambi, & A. Santangelo (Singapore: Springer Nature), 1 [Google Scholar]
- Baldini, L., Barbanera, M., Bellazzini, R., et al. 2021, Astropart. Phys., 133, 102628 [NASA ADS] [CrossRef] [Google Scholar]
- Baldini, L., Bucciantini, N., Di Lalla, N., et al. 2022, SoftwareX, 19, 101194 [NASA ADS] [CrossRef] [Google Scholar]
- Bhargava, Y., Ng, M., Zhang, L., et al. 2024a, ArXiv e-prints [arXiv: 2405.19324] [Google Scholar]
- Bhargava, Y., Russell, T. D., Ng, M., et al. 2024b, ArXiv e-prints [arXiv: 2411.00350] [Google Scholar]
- Bhattacharyya, S., & Strohmayer, T. E. 2007, ApJ, 664, L103 [NASA ADS] [CrossRef] [Google Scholar]
- Bobrikova, A., Forsblom, S. V., Di Marco, A., et al. 2024a, A&A, 688, A170 [NASA ADS] [CrossRef] [EDP Sciences] [Google Scholar]
- Bobrikova, A., Di Marco, A., La Monaca, F., et al. 2024b, A&A, 688, A217 [NASA ADS] [CrossRef] [EDP Sciences] [Google Scholar]
- Bobrikova, A., Poutanen, J., & Loktev, V. 2025, A&A, 696, A181 [NASA ADS] [CrossRef] [EDP Sciences] [Google Scholar]
- Cackett, E. M., Miller, J. M., Bhattacharyya, S., et al. 2008, ApJ, 674, 415 [NASA ADS] [CrossRef] [Google Scholar]
- Cackett, E. M., Miller, J. M., Ballantyne, D. R., et al. 2010, ApJ, 720, 205 [Google Scholar]
- Chandrasekhar, S. 1960, Radiative Transfer (New York: Dover) [Google Scholar]
- Cheng, H., Zhang, C., Ling, Z., et al. 2025, ArXiv e-prints [arXiv:2505.18939] [Google Scholar]
- Churazov, E., Sunyaev, R., & Sazonov, S. 2002, MNRAS, 330, 817 [NASA ADS] [CrossRef] [Google Scholar]
- Church, M. J., Halai, G. S., & Bałucińska-Church, M. 2006, A&A, 460, 233 [NASA ADS] [CrossRef] [EDP Sciences] [Google Scholar]
- Church, M. J., Gibiec, A., Bałucińska-Church, M., & Jackson, N. K. 2012, A&A, 546, A35 [NASA ADS] [CrossRef] [EDP Sciences] [Google Scholar]
- Cocchi, M., Gnarini, A., Fabiani, S., et al. 2023, A&A, 674, L10 [NASA ADS] [CrossRef] [EDP Sciences] [Google Scholar]
- D’Aì, A., Iaria, R., Di Salvo, T., Matt, G., & Robba, N. R. 2009, ApJ, 693, L1 [CrossRef] [Google Scholar]
- Di Marco, A. 2025, Astron. Nachr., 346, e20240126 [Google Scholar]
- Di Marco, A., Costa, E., Muleri, F., et al. 2022a, AJ, 163, 170 [NASA ADS] [CrossRef] [Google Scholar]
- Di Marco, A., Fabiani, S., La Monaca, F., et al. 2022b, AJ, 164, 103 [NASA ADS] [CrossRef] [Google Scholar]
- Di Marco, A., La Monaca, F., Poutanen, J., et al. 2023a, ApJ, 953, L22 [NASA ADS] [CrossRef] [Google Scholar]
- Di Marco, A., Soffitta, P., Costa, E., et al. 2023b, AJ, 165, 143 [CrossRef] [Google Scholar]
- Di Marco, A., La Monaca, F., Bobrikova, A., et al. 2025, ApJ, 979, L47 [Google Scholar]
- Di Salvo, T., Papitto, A., Marino, A., Iaria, R., & Burderi, L. 2024, in Handbook of X-ray and Gamma-ray Astrophysics, eds C. Bambi, & A. Santangelo (Singapore: Springer Nature), 4031 [Google Scholar]
- Done, C., Gierliński, M., & Kubota, A. 2007, A&ARv, 15, 1 [Google Scholar]
- Fabiani, S., Capitanio, F., Iaria, R., et al. 2024, A&A, 684, A137 [NASA ADS] [CrossRef] [EDP Sciences] [Google Scholar]
- Farinelli, R., Fabiani, S., Poutanen, J., et al. 2023, MNRAS, 519, 3681 [NASA ADS] [CrossRef] [Google Scholar]
- Farinelli, R., Waghmare, A., Ducci, L., & Santangelo, A. 2024, A&A, 684, A62 [NASA ADS] [CrossRef] [EDP Sciences] [Google Scholar]
- Fender, R. P., & Hendry, M. A. 2000, MNRAS, 317, 1 [NASA ADS] [CrossRef] [Google Scholar]
- Fomalont, E. B., Geldzahler, B. J., & Bradshaw, C. F. 2001a, ApJ, 553, L27 [NASA ADS] [CrossRef] [Google Scholar]
- Fomalont, E. B., Geldzahler, B. J., & Bradshaw, C. F. 2001b, ApJ, 558, 283 [Google Scholar]
- Galloway, D. K., Muno, M. P., Hartman, J. M., Psaltis, D., & Chakrabarty, D. 2008, ApJS, 179, 360 [NASA ADS] [CrossRef] [Google Scholar]
- García, J. A., Dauser, T., Ludlam, R., et al. 2022, ApJ, 926, 13 [CrossRef] [Google Scholar]
- Gendreau, K. C., Arzoumanian, Z., Adkins, P. W., et al. 2016, Proc. SPIE, 9905, 99051H [NASA ADS] [CrossRef] [Google Scholar]
- Gilfanov, M., Revnivtsev, M., & Molkov, S. 2003, A&A, 410, 217 [NASA ADS] [CrossRef] [EDP Sciences] [Google Scholar]
- Harrison, F. A., Craig, W. W., Christensen, F. E., et al. 2013, ApJ, 770, 103 [Google Scholar]
- Hasinger, G., & van der Klis, M. 1989, A&A, 225, 79 [NASA ADS] [Google Scholar]
- Huppenkothen, D., Bachetti, M., Stevens, A., et al. 2019a, J. Open Source Software, 4, 1393 [NASA ADS] [CrossRef] [Google Scholar]
- Huppenkothen, D., Bachetti, M., Stevens, A. L., et al. 2019b, ApJ, 881, 39 [Google Scholar]
- Ingram, A., Ewing, M., Marinucci, A., et al. 2023, MNRAS, 525, 5437 [CrossRef] [Google Scholar]
- Inogamov, N. A., & Sunyaev, R. A. 1999, Astron. Lett., 25, 269 [NASA ADS] [Google Scholar]
- Kislat, F., Clark, B., Beilicke, M., & Krawczynski, H. 2015, Astropart. Phys., 68, 45 [NASA ADS] [CrossRef] [Google Scholar]
- Kuulkers, E., & van der Klis, M. 1996, A&A, 314, 567 [NASA ADS] [Google Scholar]
- Kuulkers, E., van der Klis, M., Oosterbroek, T., et al. 1994, A&A, 289, 795 [NASA ADS] [Google Scholar]
- Kuulkers, E., van der Klis, M., Oosterbroek, T., van Paradijs, J., & Lewin, W. H. G. 1997, MNRAS, 287, 495 [NASA ADS] [CrossRef] [Google Scholar]
- La Monaca, F., Di Marco, A., Poutanen, J., et al. 2024a, ApJ, 960, L11 [NASA ADS] [CrossRef] [Google Scholar]
- La Monaca, F., Di Marco, A., Ludlam, R. M., et al. 2024b, A&A, 691, A253 [NASA ADS] [CrossRef] [EDP Sciences] [Google Scholar]
- La Monaca, F., Bobrikova, A., Poutanen, J., et al. 2025, A&A, 702, A40 [NASA ADS] [CrossRef] [EDP Sciences] [Google Scholar]
- Li, S., Ludlam, R. M., Buisson, D. J. K., et al. 2025, ApJ, submitted [arXiv:2503.20050] [Google Scholar]
- Loktev, V., Veledina, A., & Poutanen, J. 2022, A&A, 660, A25 [NASA ADS] [CrossRef] [EDP Sciences] [Google Scholar]
- Ludlam, R. M. 2024, Ap&SS, 369, 16 [NASA ADS] [CrossRef] [Google Scholar]
- Ludlam, R. M., Miller, J. M., Cackett, E. M., Degenaar, N., & Bostrom, A. C. 2017, ApJ, 838, 79 [NASA ADS] [CrossRef] [Google Scholar]
- Ludlam, R. M., Cackett, E. M., García, J. A., et al. 2022, ApJ, 927, 112 [NASA ADS] [CrossRef] [Google Scholar]
- Ludlam, R. M., Ballhausen, R., Chakraborty, P., et al. 2025, PASJ, in press [arXiv:2507.06289] [Google Scholar]
- Matt, G. 1993, MNRAS, 260, 663 [NASA ADS] [CrossRef] [Google Scholar]
- Miller, M. C., & Miller, J. M. 2015, Phys. Rep., 548, 1 [NASA ADS] [CrossRef] [Google Scholar]
- Miller, K. A., & Stone, J. M. 2000, ApJ, 534, 398 [NASA ADS] [CrossRef] [Google Scholar]
- Miller, J. M., Parker, M. L., Fuerst, F., et al. 2013, ApJ, 779, L2 [NASA ADS] [CrossRef] [Google Scholar]
- Miller, J. M., Raymond, J., Cackett, E., Grinberg, V., & Nowak, M. 2016, ApJ, 822, L18 [NASA ADS] [CrossRef] [Google Scholar]
- Mitsuda, K., Inoue, H., Koyama, K., et al. 1984, PASJ, 36, 741 [NASA ADS] [Google Scholar]
- Mitsuda, K., Inoue, H., Nakamura, N., & Tanaka, Y. 1989, PASJ, 41, 97 [NASA ADS] [Google Scholar]
- Motta, S. E., & Fender, R. P. 2019, MNRAS, 483, 3686 [Google Scholar]
- Nitindala, A. P., Veledina, A., & Poutanen, J. 2025, A&A, 694, A230 [NASA ADS] [CrossRef] [EDP Sciences] [Google Scholar]
- Nasa High Energy Astrophysics Science Archive Research Center (Heasarc) 2014, Astrophysics Source Code Library [record ascl:1408.004] [Google Scholar]
- Parmar, A. N., & White, N. E. 1988, Mem. Soc. Astron. It., 59, 147 [NASA ADS] [Google Scholar]
- Popham, R., & Sunyaev, R. 2001, ApJ, 547, 355 [NASA ADS] [CrossRef] [Google Scholar]
- Poutanen, J., Nagendra, K. N., & Svensson, R. 1996, MNRAS, 283, 892 [NASA ADS] [CrossRef] [Google Scholar]
- Prakash, V. P. S., Agrawal, V. K., & Vinodkumar, A. M. 2025, MNRAS, 540, 1578 [Google Scholar]
- Psaltis, D., Lamb, F. K., & Miller, G. S. 1995, ApJ, 454, L137 [NASA ADS] [Google Scholar]
- Rankin, J., La Monaca, F., Di Marco, A., et al. 2024, ApJ, 961, L8 [NASA ADS] [CrossRef] [Google Scholar]
- Revnivtsev, M. G., & Gilfanov, M. R. 2006, A&A, 453, 253 [NASA ADS] [CrossRef] [EDP Sciences] [Google Scholar]
- Revnivtsev, M. G., Suleimanov, V. F., & Poutanen, J. 2013, MNRAS, 434, 2355 [NASA ADS] [CrossRef] [Google Scholar]
- Shakura, N. I., & Sunyaev, R. A. 1988, Adv. Space Res., 8, 135 [NASA ADS] [CrossRef] [Google Scholar]
- Sobolev, V. V. 1963, A Treatise on Radiative Transfer (Princeton: Van Nostrand) [Google Scholar]
- Soffitta, P., Baldini, L., Bellazzini, R., et al. 2021, AJ, 162, 208 [CrossRef] [Google Scholar]
- Spencer, R. E., Rushton, A. P., Bałucińska-Church, M., et al. 2013, MNRAS, 435, L48 [NASA ADS] [CrossRef] [Google Scholar]
- Suleimanov, V., & Poutanen, J. 2006, MNRAS, 369, 2036 [NASA ADS] [CrossRef] [Google Scholar]
- Sunyaev, R. A., & Titarchuk, L. G. 1985, A&A, 143, 374 [NASA ADS] [Google Scholar]
- Tomaru, R., Done, C., & Odaka, H. 2024, MNRAS, 527, 7047 [Google Scholar]
- Ursini, F., Gnarini, A., Capitanio, F., et al. 2024, Galaxies, 12, 43 [NASA ADS] [CrossRef] [Google Scholar]
- van der Klis, M. 1989, ARA&A, 27, 517 [NASA ADS] [CrossRef] [Google Scholar]
- Veledina, A., Muleri, F., Poutanen, J., et al. 2024, Nat. Astron., 8, 1031 [NASA ADS] [CrossRef] [Google Scholar]
- Weisskopf, M. C., Soffitta, P., Baldini, L., et al. 2022, JATIS, 8, 026002 [NASA ADS] [Google Scholar]
- White, N. E., & Holt, S. S. 1982, ApJ, 257, 318 [NASA ADS] [CrossRef] [Google Scholar]
- Wilms, J., Allen, A., & McCray, R. 2000, ApJ, 542, 914 [Google Scholar]
- Yuan, W., Zhang, C., Chen, Y., & Ling, Z. 2022, in Handbook of X-ray and Gamma-ray Astrophysics, eds. C. Bambi, & A. Sangangelo, 86 [Google Scholar]
- Yuan, W., Dai, L., Feng, H., et al. 2025, Sci. China Phys. Mech. Astron., 68, 239501 [Google Scholar]
- Zhao, Q.-C., Li, H., Tao, L., & Feng, H. 2025, ApJ, 982, 105 [Google Scholar]
All Tables
List of telescopes and/or instruments with the respective observation IDs and the exposure times of each observation.
Best-fit parameters of the broadband joint spectral analysis for GX 340+0 in the NB obtained by NICER, NuSTAR, and IXPE.
Weighted spectropolarimetric analysis of GX 340+0 in the NB in the 2–8 keV using Model A combined with different polarisation models: polconst, pollin, and polpow.
All Figures
|
Fig. 1. Light curves, HRs, and polarisation properties of GX 340+0 during the second IXPE observation. (a): IXPE light curve binned in 600 s intervals overlapped with the EP-WXT light curve (dodger blue points). The highlighted coloured intervals correspond to the NICER simultaneous observations reported in Table 1 and Fig. 3. (b): IXPE HR binned in 600 s obtained as the ratio of the IXPE counting rates in the 4–8 and 2–4 keV energy bands. (c) and (d): Time-resolved PD and PA in equal time bins of about 9.5 h. The errors are reported at 68% CL, while the upper limits are at 90% CL. |
| In the text | |
|
Fig. 3. HIDs of GX 340+0 in 150 s time bin. Top panel: HID of GX 340+0 from the NICER data archive (grey points). The coloured points represent the five NICER observations performed during the IXPE one and also reported in Table 1 and Fig. 1-top as shaded coloured regions in the IXPE light curve. Bottom panel: HID of GX 340+0 from the NuSTAR archival data (grey points). The olive green points represent the NuSTAR observation selected to perform the spectral and spectropolarimetric analysis. |
| In the text | |
|
Fig. 2. IXPE HID of the second IXPE observation of GX 340+0 in 600 s time bins. The grey points represent the first IXPE observation, while the coloured ones, from dark blue to yellow, report the elapsed time in hours since the start of the second IXPE observation. The dotted black line defines the region we used to select the NB. |
| In the text | |
|
Fig. 4. Energy-dependent polarimetric properties of GX 340+0 in the NS. PD (top panel) and PA (bottom panel) as a function of the energy in 1 keV energy bins. The errors are reported at 68% CL, while the upper limit is at 90% CL, see text. |
| In the text | |
|
Fig. 5. Polarisation in the HB (blue) and in the NB (purple) of GX 340+0. The contours represent the allowed regions at 68%, 90%, and 99% CL. |
| In the text | |
|
Fig. 6. Spectral energy distribution of GX 340+0 in EFE representation for the simultaneous fit using Model A of NICER (dark yellow points), IXPE (red points), and NuSTAR (blue points) observations. The different spectral model components are reported in black lines for diskbb (dashed), bbodyrad (dotted), and Gaussian (dash-dotted). The bottom panel shows the residuals between the data and the best-fit Model A. The best-fit parameters are reported in Table 3. |
| In the text | |
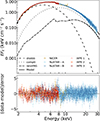 |
Fig. 7. Same as Fig. 6 but for Model B, with the dash-dotted lines showing the relxillNS component. |
| In the text | |
|
Fig. 8. Polar plot with the results of the spectropolarimetric analysis for GX 340+0 in the NB and in the HB: a polconst component is associated with the diskbb and comptt components separately, without any prior constraints on the PA. The contours represent the allowed regions at 90% CL. The colour-shaded contours for the HB are from La Monaca et al. (2024b). The dark blue star represents the maximum polarisation expected by a SL (Bobrikova et al. 2025); see Sect. 4. |
| In the text | |
Current usage metrics show cumulative count of Article Views (full-text article views including HTML views, PDF and ePub downloads, according to the available data) and Abstracts Views on Vision4Press platform.
Data correspond to usage on the plateform after 2015. The current usage metrics is available 48-96 hours after online publication and is updated daily on week days.
Initial download of the metrics may take a while.