Fig. 10.
Download original image
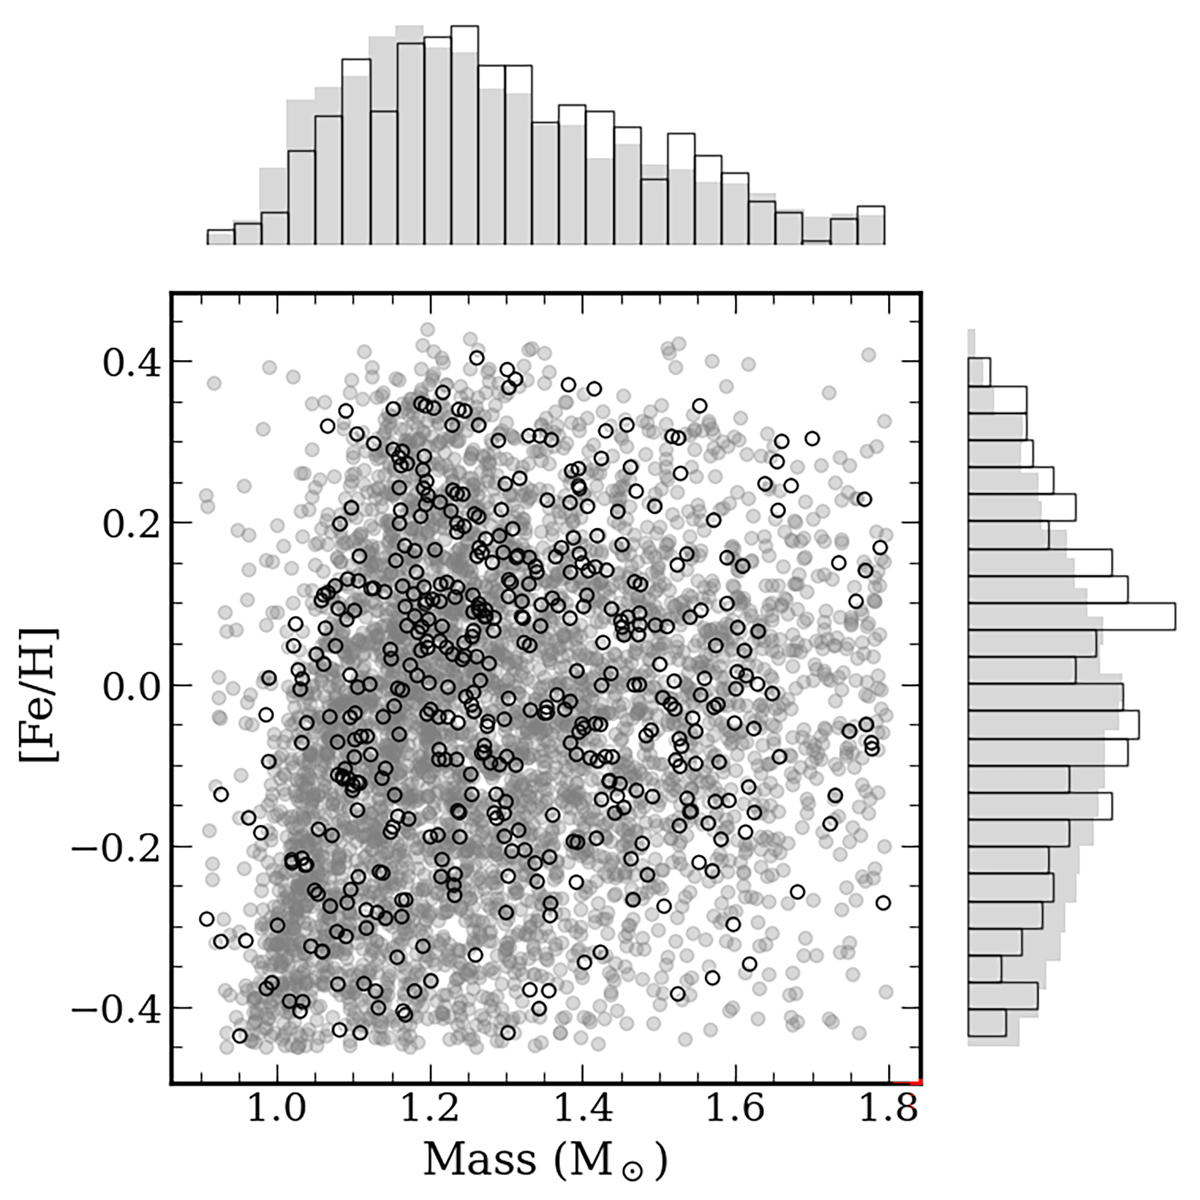
Mass vs. [Fe/H]: The open black circles and black-outlined histograms represent the sample from this paper with available APOGEE spectra, while the semitransparent circles and gray histograms correspond to data from the APOKASC-3 paper (Pinsonneault et al. 2025). The stars flagged as being part of the RC in APOKASC-3 were removed from this figure.
Current usage metrics show cumulative count of Article Views (full-text article views including HTML views, PDF and ePub downloads, according to the available data) and Abstracts Views on Vision4Press platform.
Data correspond to usage on the plateform after 2015. The current usage metrics is available 48-96 hours after online publication and is updated daily on week days.
Initial download of the metrics may take a while.