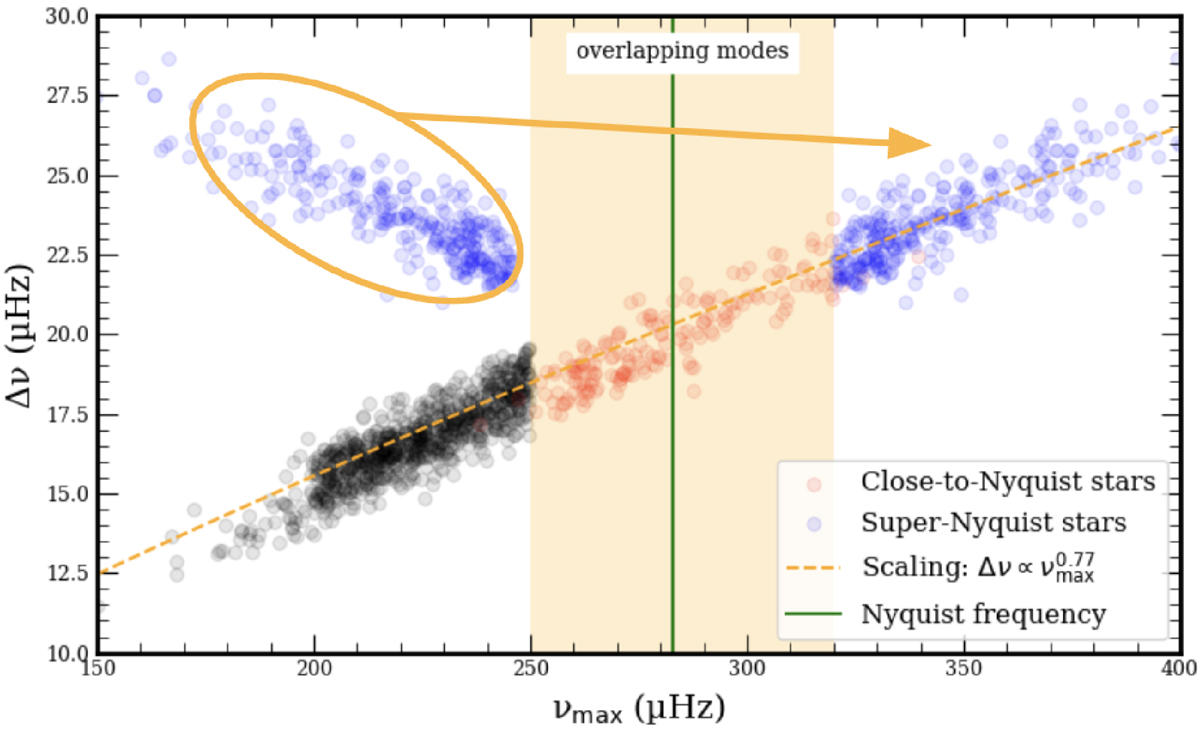
Fig. B.1.
Download original image
Stars recovered in this work, shown along with the scaling relation adopted in our analysis (orange dashed line). The vertical green line marks the Nyquist frequency. To the left of this line, sub-Nyquist stars are shown in black and super-Nyquist stars, initially misidentified with a frequency νmax = νmax,sub, are shown in blue. To the right of the Nyquist frequency, the same super-Nyquist stars are plotted in blue with their corrected values νmax = 2 × νNyq − νmax,sub. Stars located near the Nyquist frequency, where mode overlap is significant, are shown in red within the yellow shaded region.
Current usage metrics show cumulative count of Article Views (full-text article views including HTML views, PDF and ePub downloads, according to the available data) and Abstracts Views on Vision4Press platform.
Data correspond to usage on the plateform after 2015. The current usage metrics is available 48-96 hours after online publication and is updated daily on week days.
Initial download of the metrics may take a while.