Fig. 3.
Download original image
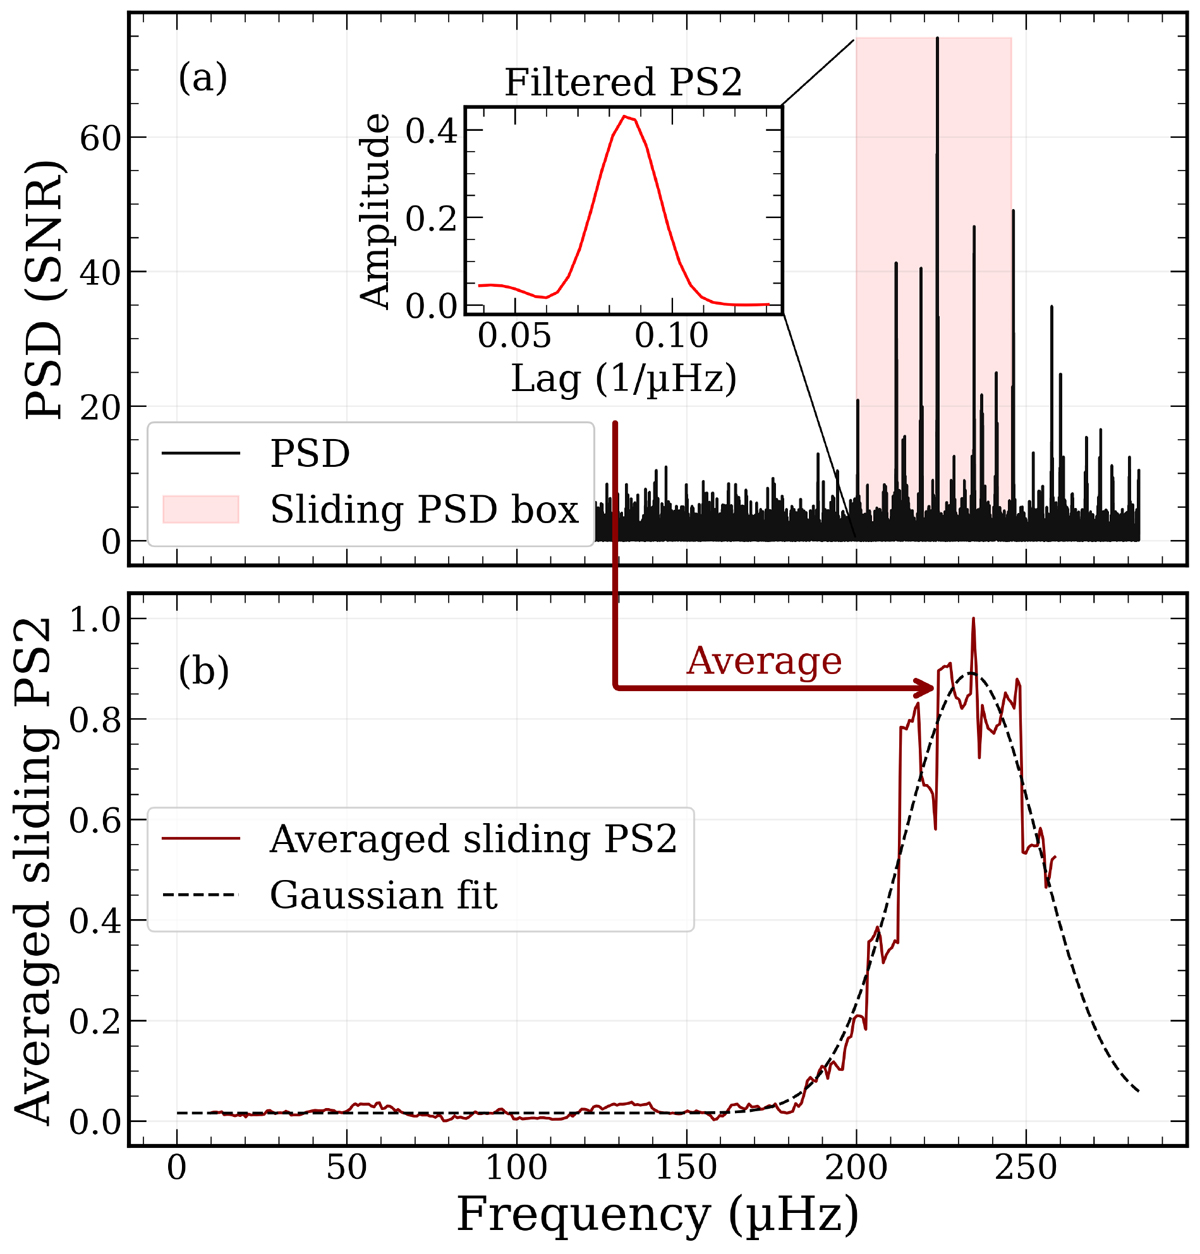
(a) PSD of the Kepler star KIC 8179973 on which a sliding box (shaded pink area) was used to compute the PS2 (inset) with Γ = 2 and filtered as explained in Section 3.1.1. (b) The red line is the averaged filtered PS2 normalized to its maximum value as a function of the center of the sliding windows. The dashed black line is the Gaussian fit.
Current usage metrics show cumulative count of Article Views (full-text article views including HTML views, PDF and ePub downloads, according to the available data) and Abstracts Views on Vision4Press platform.
Data correspond to usage on the plateform after 2015. The current usage metrics is available 48-96 hours after online publication and is updated daily on week days.
Initial download of the metrics may take a while.