Fig. 4.
Download original image
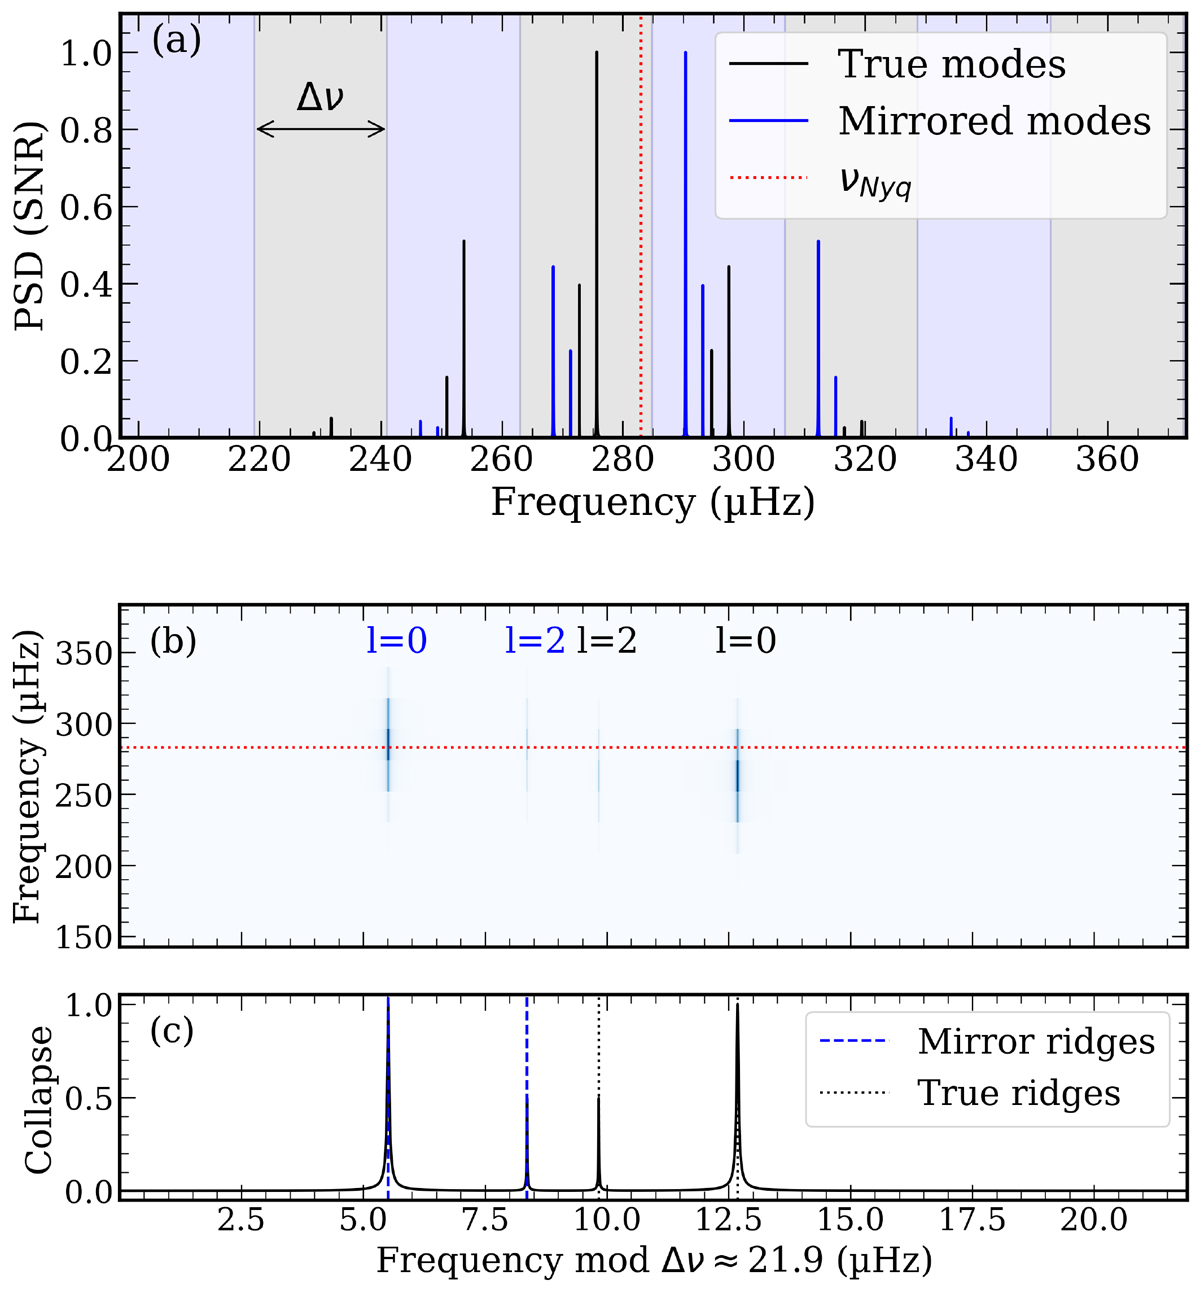
(a) Synthesized PSD of the ℓ = 0, 2 modes of a star with νmax = 275 μHz. The black modes are the true modes, whereas the blue modes are those observed because of the undersampling: they are the black modes mirrored around νNyq. Each box of width Δν matches to one line of the echelle diagram shown in panel (b) along with its collapse in (c). In (b), the ridges due to the true modes are annotated in black, whereas those annotated in blue are due to the shadow modes. In (c) the peaks due to the mirrored modes are marked with a vertical dashed blue line and the peaks due to the true modes are marked with a vertical dotted black line.
Current usage metrics show cumulative count of Article Views (full-text article views including HTML views, PDF and ePub downloads, according to the available data) and Abstracts Views on Vision4Press platform.
Data correspond to usage on the plateform after 2015. The current usage metrics is available 48-96 hours after online publication and is updated daily on week days.
Initial download of the metrics may take a while.