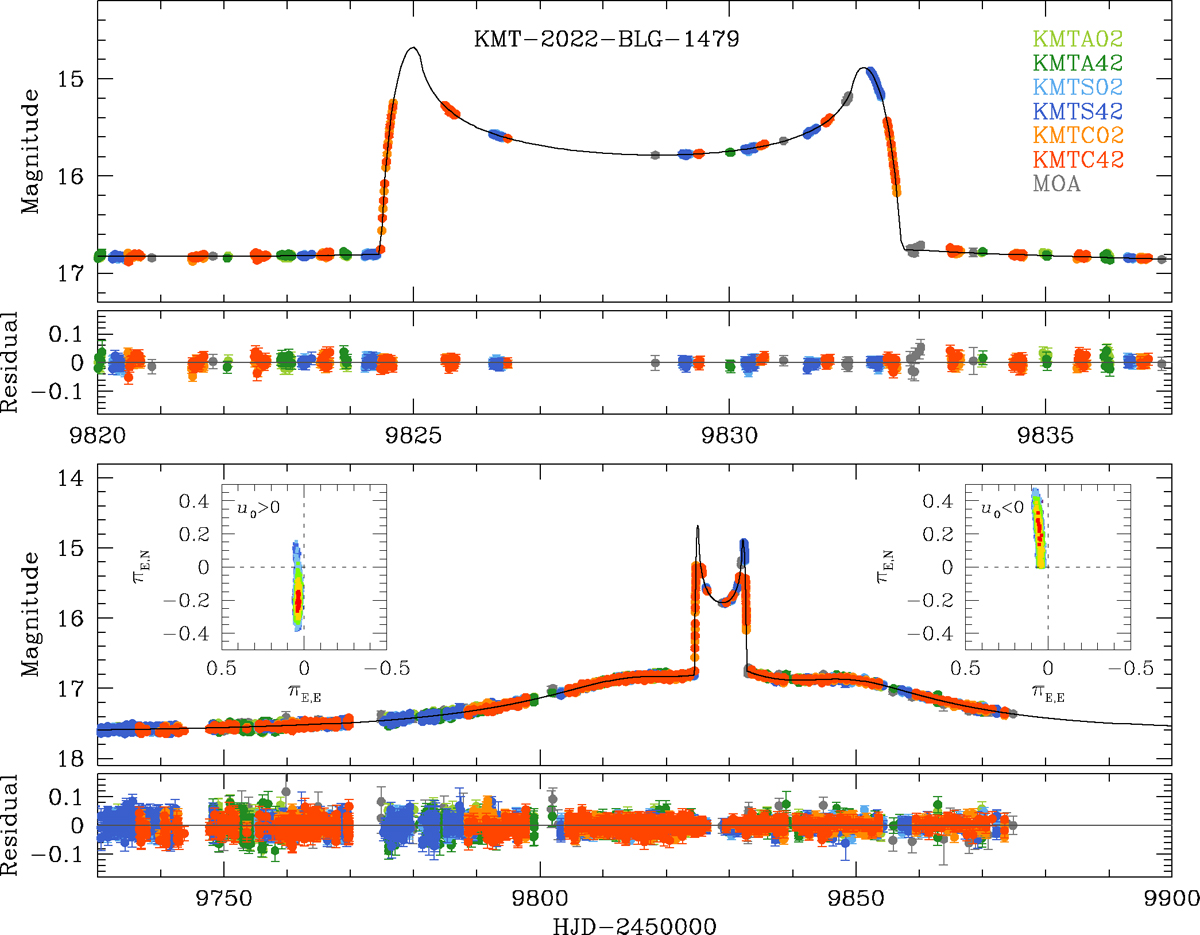
Fig. 1.
Download original image
Light curve of the lensing event KMT-2022-BLG-1479. Two lower: Overall light curve and the residuals from the model. Two upper panels: Magnified view of the anomaly region. The curve overlaid on the data points represents the best-fit 2L1S model (higher-order model with u0 > 0), which incorporates higher-order effects. The colors of the data points correspond to the labels in the legend. The two insets in the lower panel display scatter plots of points from the MCMC chain in the πE, E–πE, N parameter plane for the u0 > 0 and u0 < 0 solutions. Points within 1σ, 2σ, 3σ, 4σ, and 5σ confidence levels are marked in red, yellow, green, cyan, and blue, respectively.
Current usage metrics show cumulative count of Article Views (full-text article views including HTML views, PDF and ePub downloads, according to the available data) and Abstracts Views on Vision4Press platform.
Data correspond to usage on the plateform after 2015. The current usage metrics is available 48-96 hours after online publication and is updated daily on week days.
Initial download of the metrics may take a while.