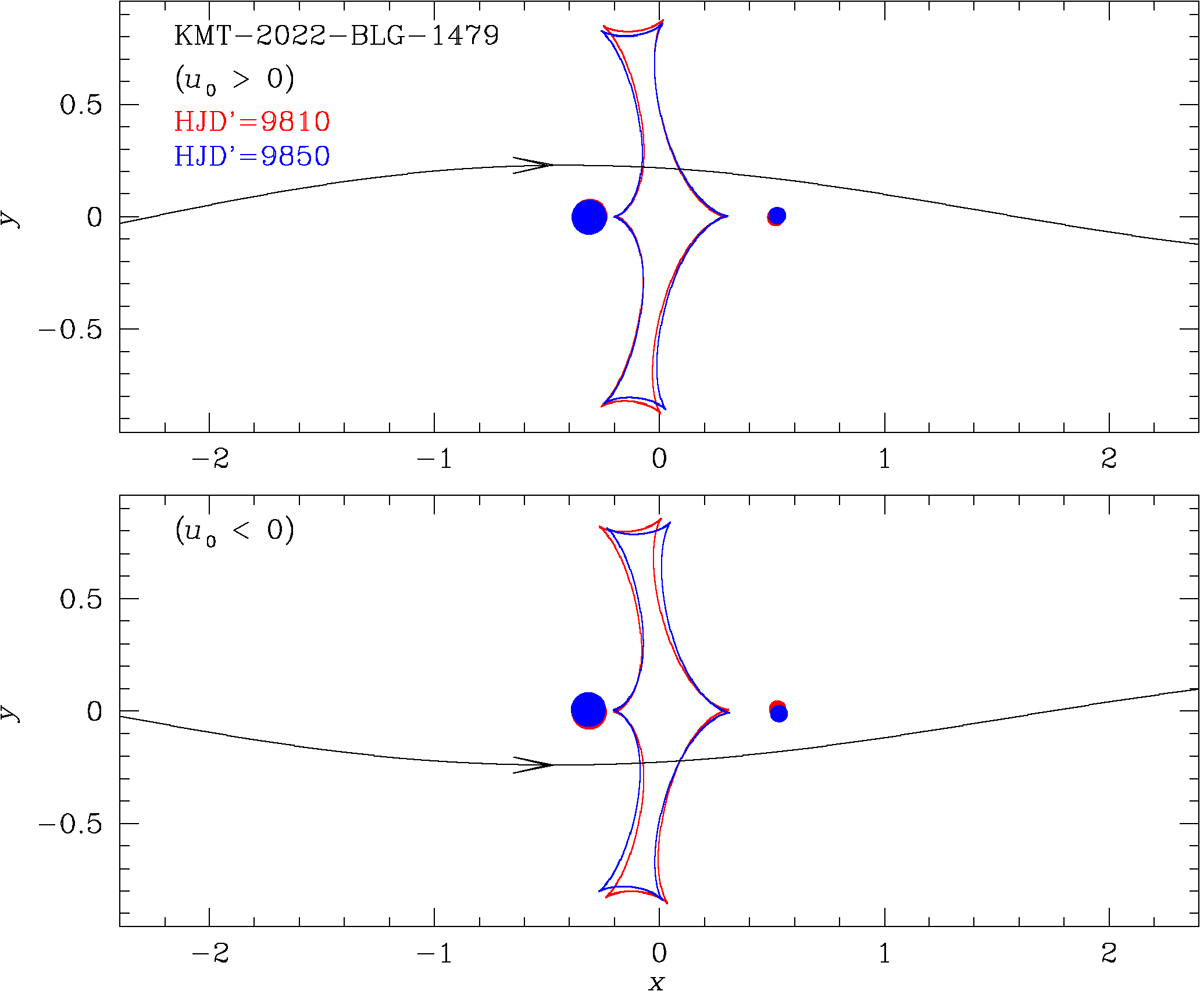
Fig. 2.
Download original image
Lens system configuration of KMT-2022-BLG-1479 for the two higher-order models with u0 > 0 and u0 < 0. In each panel, the trajectory of the source is indicated by the arrowed curve. The red and blue concave curves represent the caustics at the times specified in the legend The positions of the lens components are marked by filled dots, with the larger dot corresponding to the more massive lens component.
Current usage metrics show cumulative count of Article Views (full-text article views including HTML views, PDF and ePub downloads, according to the available data) and Abstracts Views on Vision4Press platform.
Data correspond to usage on the plateform after 2015. The current usage metrics is available 48-96 hours after online publication and is updated daily on week days.
Initial download of the metrics may take a while.