Fig. 3
Download original image
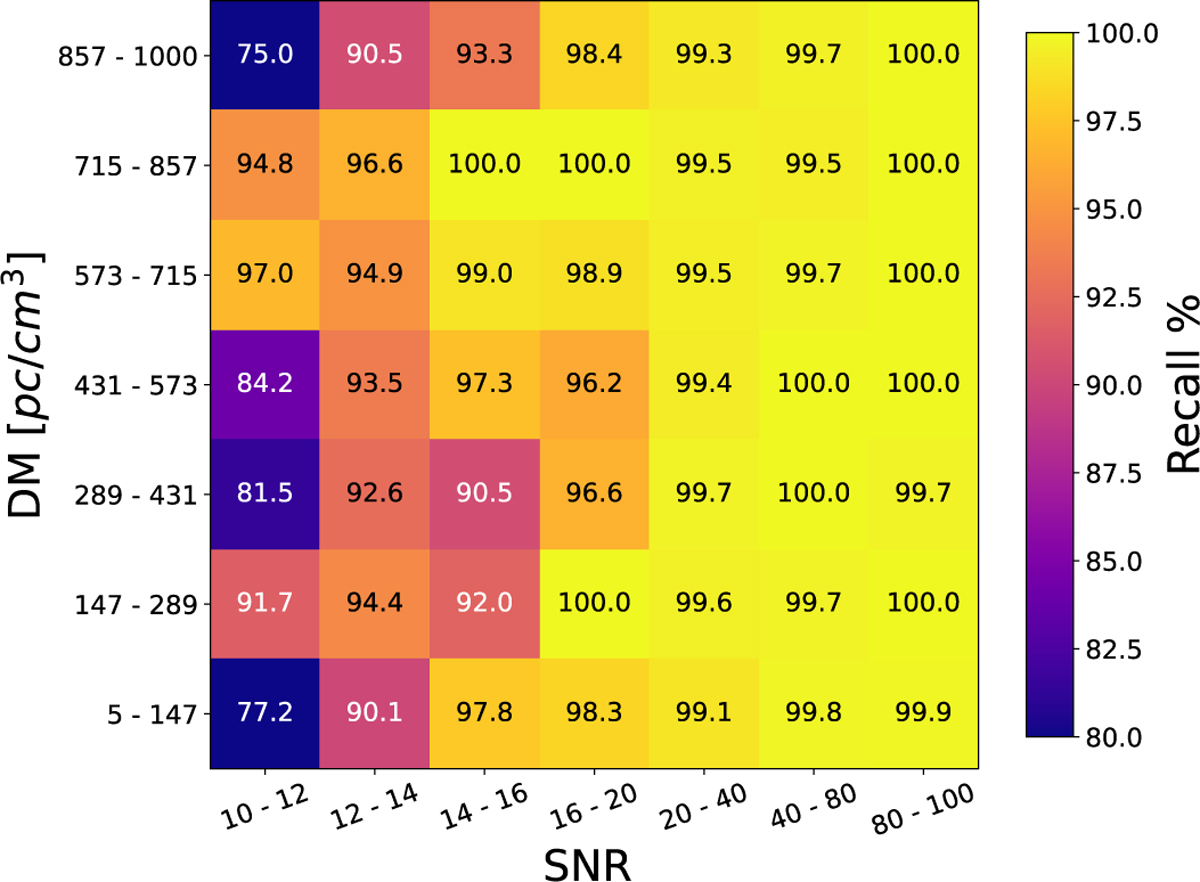
Recall (%) as a function of S/N and DM in the FRB detection model. Each cell shows the recall score achieved in a given (S/N, DM) bin, with warmer colors indicating higher recall. Axes are labeled with S/N ranges (x-axis) and DM ranges in units of pc/cm3 (y-axis). The model demonstrates high recall in most regions, particularly at high S/Ns and intermediate DMs. Performance degrades noticeably at low S/N (≤14) and at both extremes of the DM range (DM < 147 and DM > 857 pc/cm3), likely due to under-representation in training or edge effects in preprocessing.
Current usage metrics show cumulative count of Article Views (full-text article views including HTML views, PDF and ePub downloads, according to the available data) and Abstracts Views on Vision4Press platform.
Data correspond to usage on the plateform after 2015. The current usage metrics is available 48-96 hours after online publication and is updated daily on week days.
Initial download of the metrics may take a while.