Fig. 1
Download original image
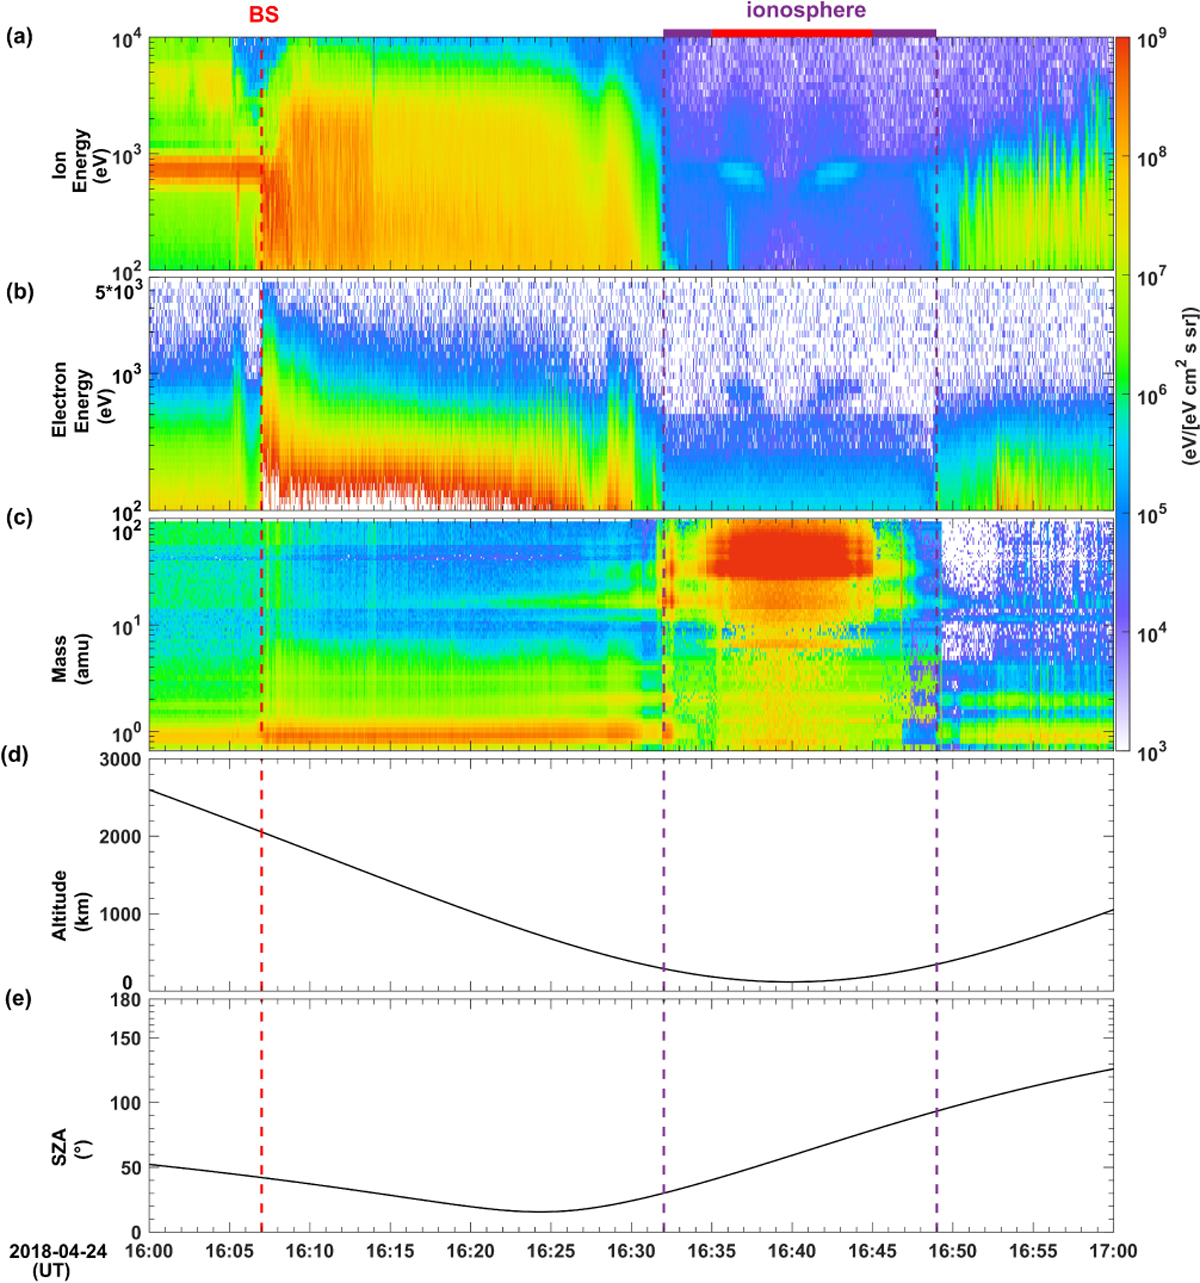
MAVEN in situ observations during 16:00-17:00 UT on 24 April 2018 including (a) the SWIA ion energy spectrum, (b) the SWEA electron energy spectrum, (c) the STATIC mass spectrum, (d) the MAVEN spacecraft altitude, and (e) the SZA at the MAVEN spacecraft position. The vertical dashed red line marks the BS crossing. The vertical dashed purple lines and the horizontal purple bar at the top of Fig. 1 indicate the time intervals during which MAVEN was in the Martian ionosphere. The H+ and H− event is shown by the horizontal red bar at the top of Fig. 1.
Current usage metrics show cumulative count of Article Views (full-text article views including HTML views, PDF and ePub downloads, according to the available data) and Abstracts Views on Vision4Press platform.
Data correspond to usage on the plateform after 2015. The current usage metrics is available 48-96 hours after online publication and is updated daily on week days.
Initial download of the metrics may take a while.